Resources
2024 Physician Compensation Report
Complete the form to download your free copy!

Practicing medicine isn’t all about money, but every physician deserves to be compensated fairly and equitably.
Your career decisions depend on accurate data. You may be wondering if your compensation or signing bonus is competitive.
Knowing how much others are paid in your specialty, city, or an area where you’re considering a move can help you to protect your earnings and keep your career on a positive trajectory.
Pro Tip: Our team can review your compensation, as well as negotiate for better terms. Reach out today to learn more.
The 2024 Physician Compensation Report Answers Questions About:
- Highest-paid specialties
- Pay differences between cities and states
- Your specialty compared to others
- Biases in compensation
- Highest demand specialties
- Regions with high needs for your specialty
- Locations where physicians are getting the highest bonuses
You could spend a lot of time looking over hundreds of pages in highly-technical compensation reports to get the information you need, but you don’t have to.
The annual physician compensation report saves you time and money. It has the information you need to know.
THIS REPORT COVERS:
- Detailed information about medical specialties and regional compensation
- Gender wage gaps
- Physician incentives
- Specialties in the greatest demand
- Trends in compensation and recent changes
The FREE Physicians Thrive 2024 Physician Compensation Report compiles data from almost a dozen sources.
ff
The Free Physicians Thrive 2024 Physician Compensation Report
Each year, salaries rise or decline in different regions and specialties. Bonuses also change depending upon demand for physicians in various regions and specialties.
We’ve broken down the compensation trends for physicians by specialty, region, gender, and by bonus incentive. This shows where salaries are increasing and where they’re on the decline.
Compensation by Region
There’s been major change in several metro areas which have been identified as high-paying in prior years. Several metro areas which recorded high pay increases in the past don’t make the list this year.
The majority of metro areas that did show growth in salaries in our 2023 report had growth rates less than 3%. Over three-quarters of all metro areas surveyed showed salary growth rates of less than 1%. Out of last year’s metro areas which recorded significant physician salary growth, only Sacramento stayed on the list, and its growth rate of 1.1% placed it as #10 on the list.
Several metro areas in California did show salary growth, in addition to Sacramento, and the other metros that had salary bumps were distributed throughout the Midwest, East Coast, and West.
Metro areas with the biggest salary increases:
- Oklahoma City +6.3%
- Baltimore +4.6%
- Salt Lake City +2.9%
- Indianapolis +2.5%
- San Jose +2.4%
- Providence +2.4%
- Louisville +2.2%
- Riverside +1.8%
- San Diego +1.5%
- Sacramento +1.1%
Metro areas that pay the highest salaries:
- Charlotte $430,890
- St. Louis $426,370
- Oklahoma City $425,096
- San Jose $418,600
- Minneapolis $425,634
- Sacramento $425,059
- Phoenix $422,735
- Indianapolis $419,359
- Salt Lake City $408,044
- Atlanta $407,863
Metro areas that pay the lowest salaries:
- Washington, DC $342,139
- Baltimore $346,260
- Boston $347,553
- San Antonio $347,692
- Raleigh $351,732
- Providence $354,342
- Virginia Beach $354,587
- Denver $357,010
- Philadelphia $358,443
- Birmingham $361,463
As with previous years in our reports, all of the higher-paying US metro areas are over $400,000 a year in compensation. However, between 2022 and 2023, on average, the compensation for physicians across all metro areas declined 2.4%.
Last year, Charlotte and St. Louis were the highest-compensated metro areas, and they remained the highest paying this year. Industry reports note that with over 9% inflation across the U.S. in 2022, physicians saw a decrease in real income on average, even in the higher paying metro areas. Eastern seaboard cities continue to offer lower compensation than other regions, in large part because these cities are losing population. Some areas that made the highest-paying list in previous years, like Raleigh, are now on the lowest-paying list.
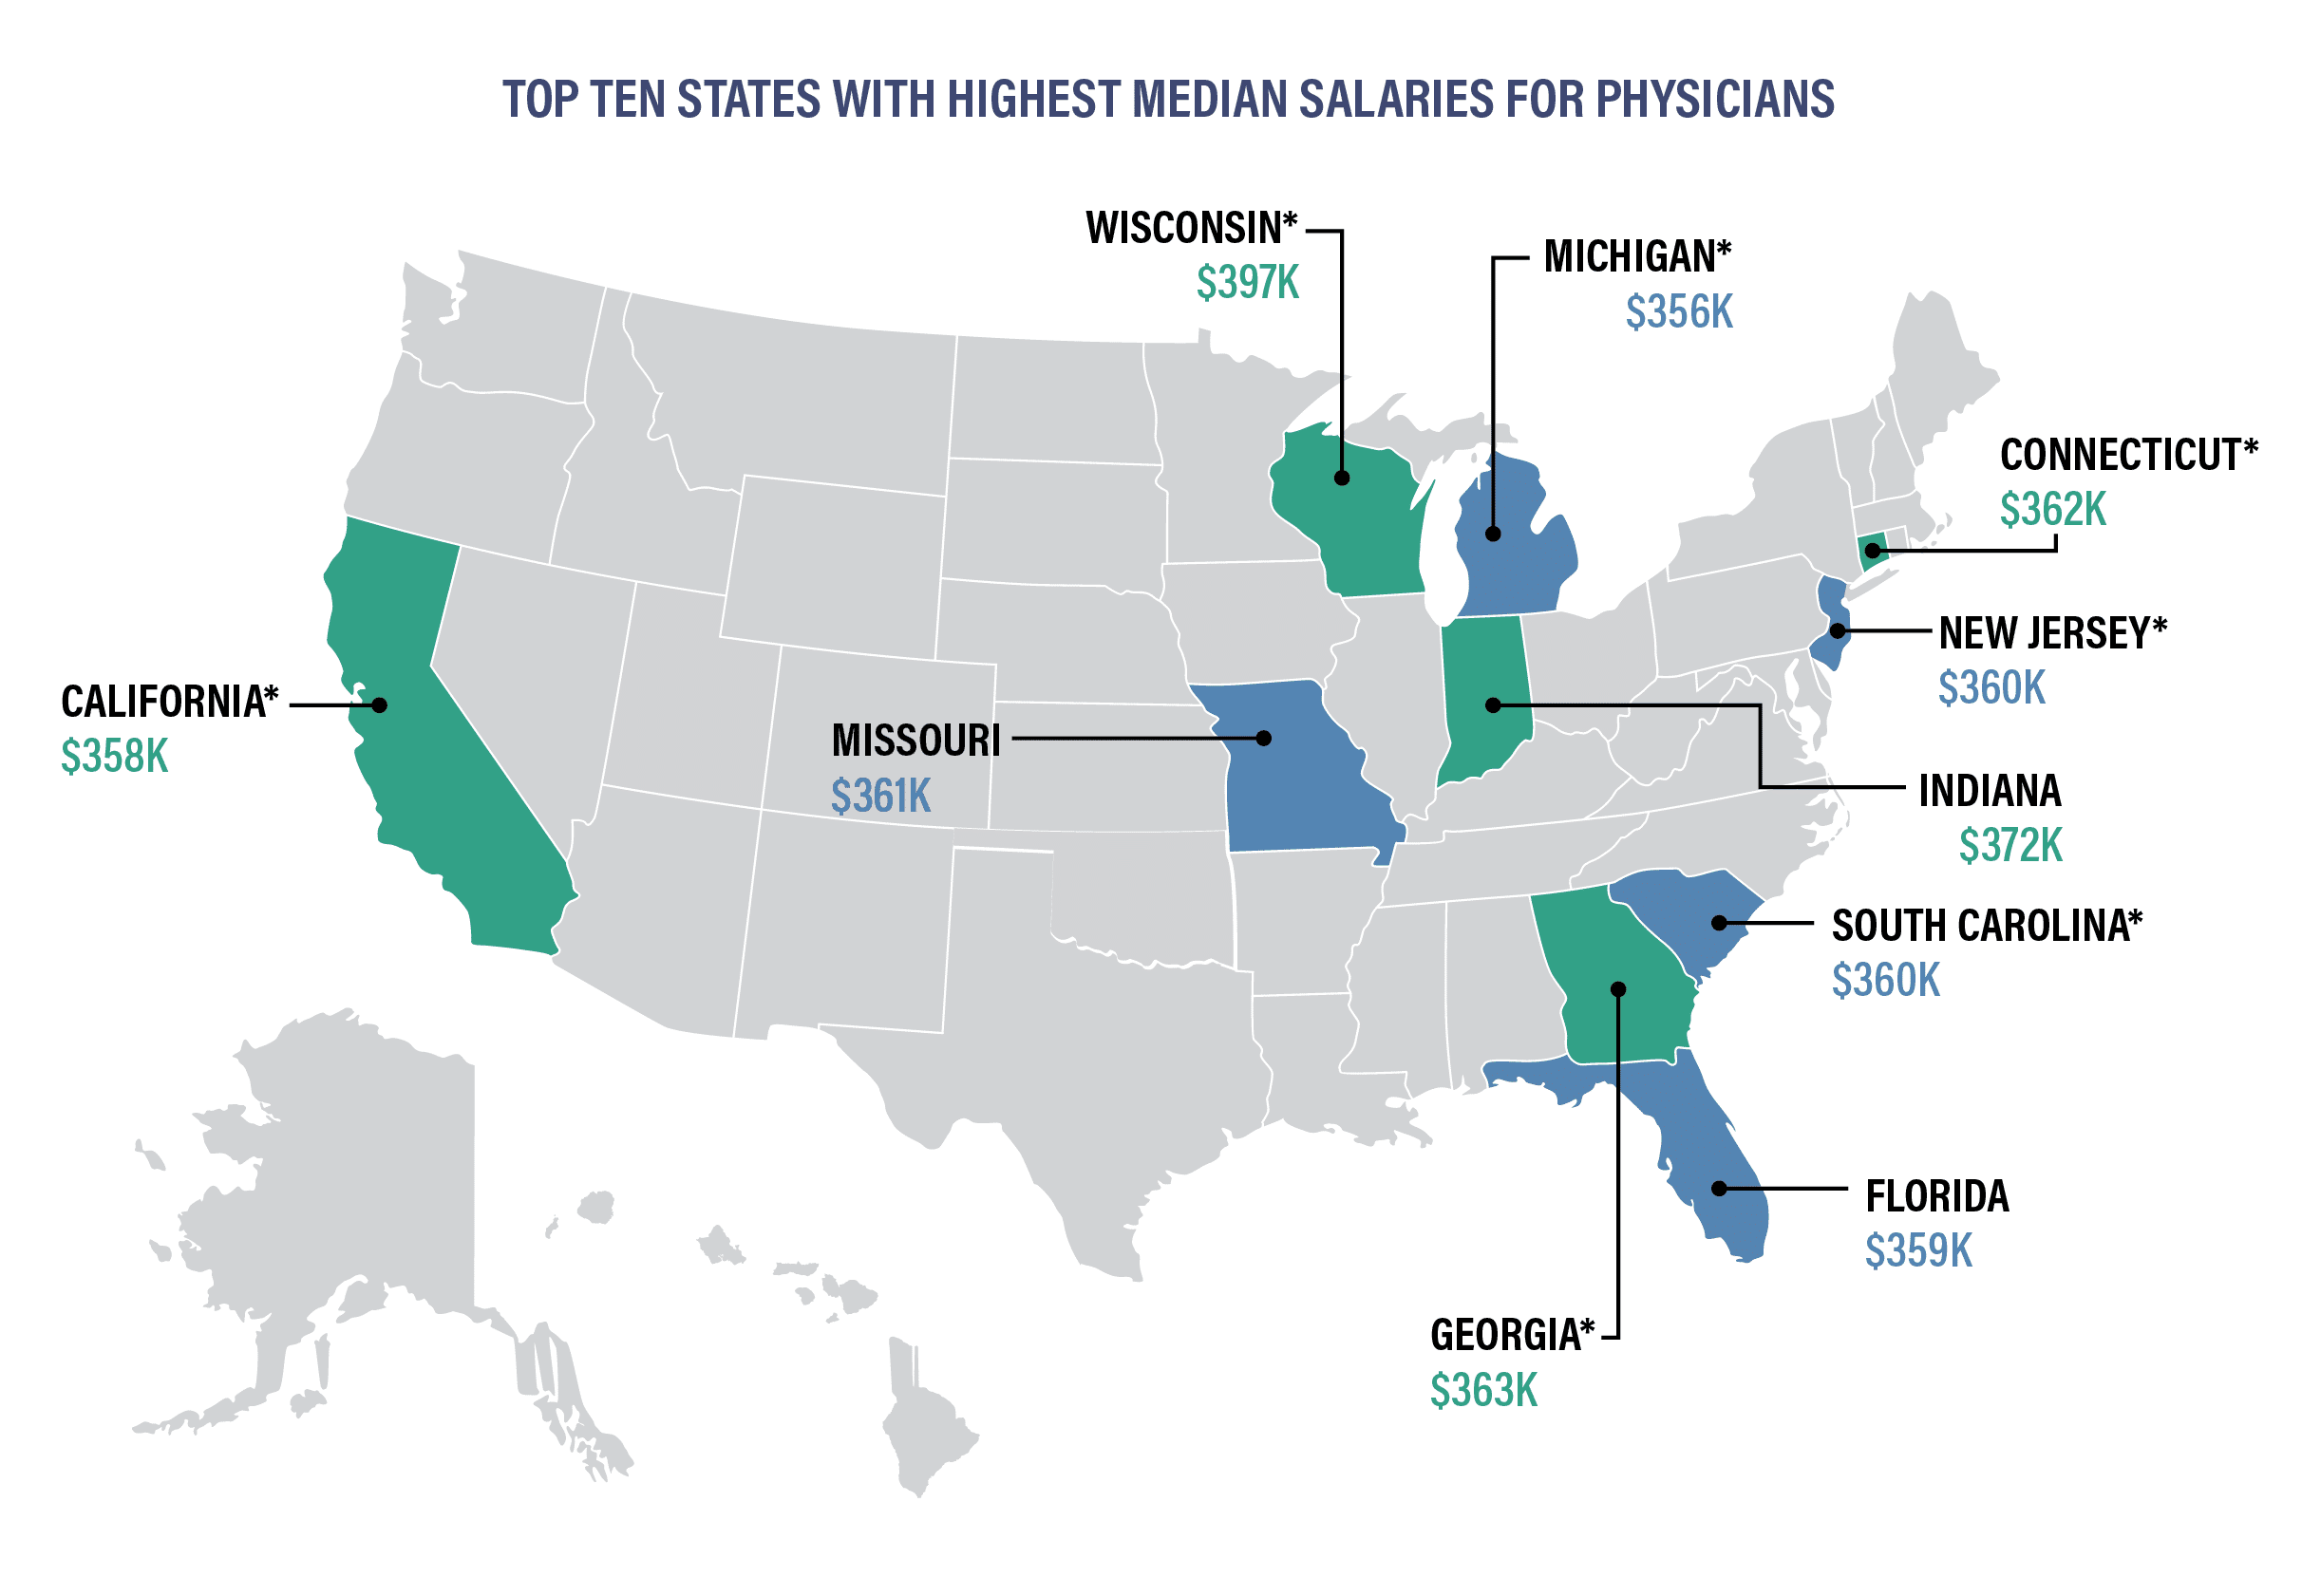
*Indicates states that are new to the top ten for 2024.
Indiana, Connecticut, Missouri, and Florida have been on the highest median physician salary list for two years in a row. Although California is one of the ten states with the highest median physician salary, it is also one of the states that are projected to have the largest shortage of physicians by 2030. Florida, Georgia, and South Carolina are Southern states with relatively large retiree populations which all appeared on the top ten median salary list this year.
Texas, Tennessee, Alabama, Oregon, Kentucky and North Caronlina are no longer in the Top Ten.
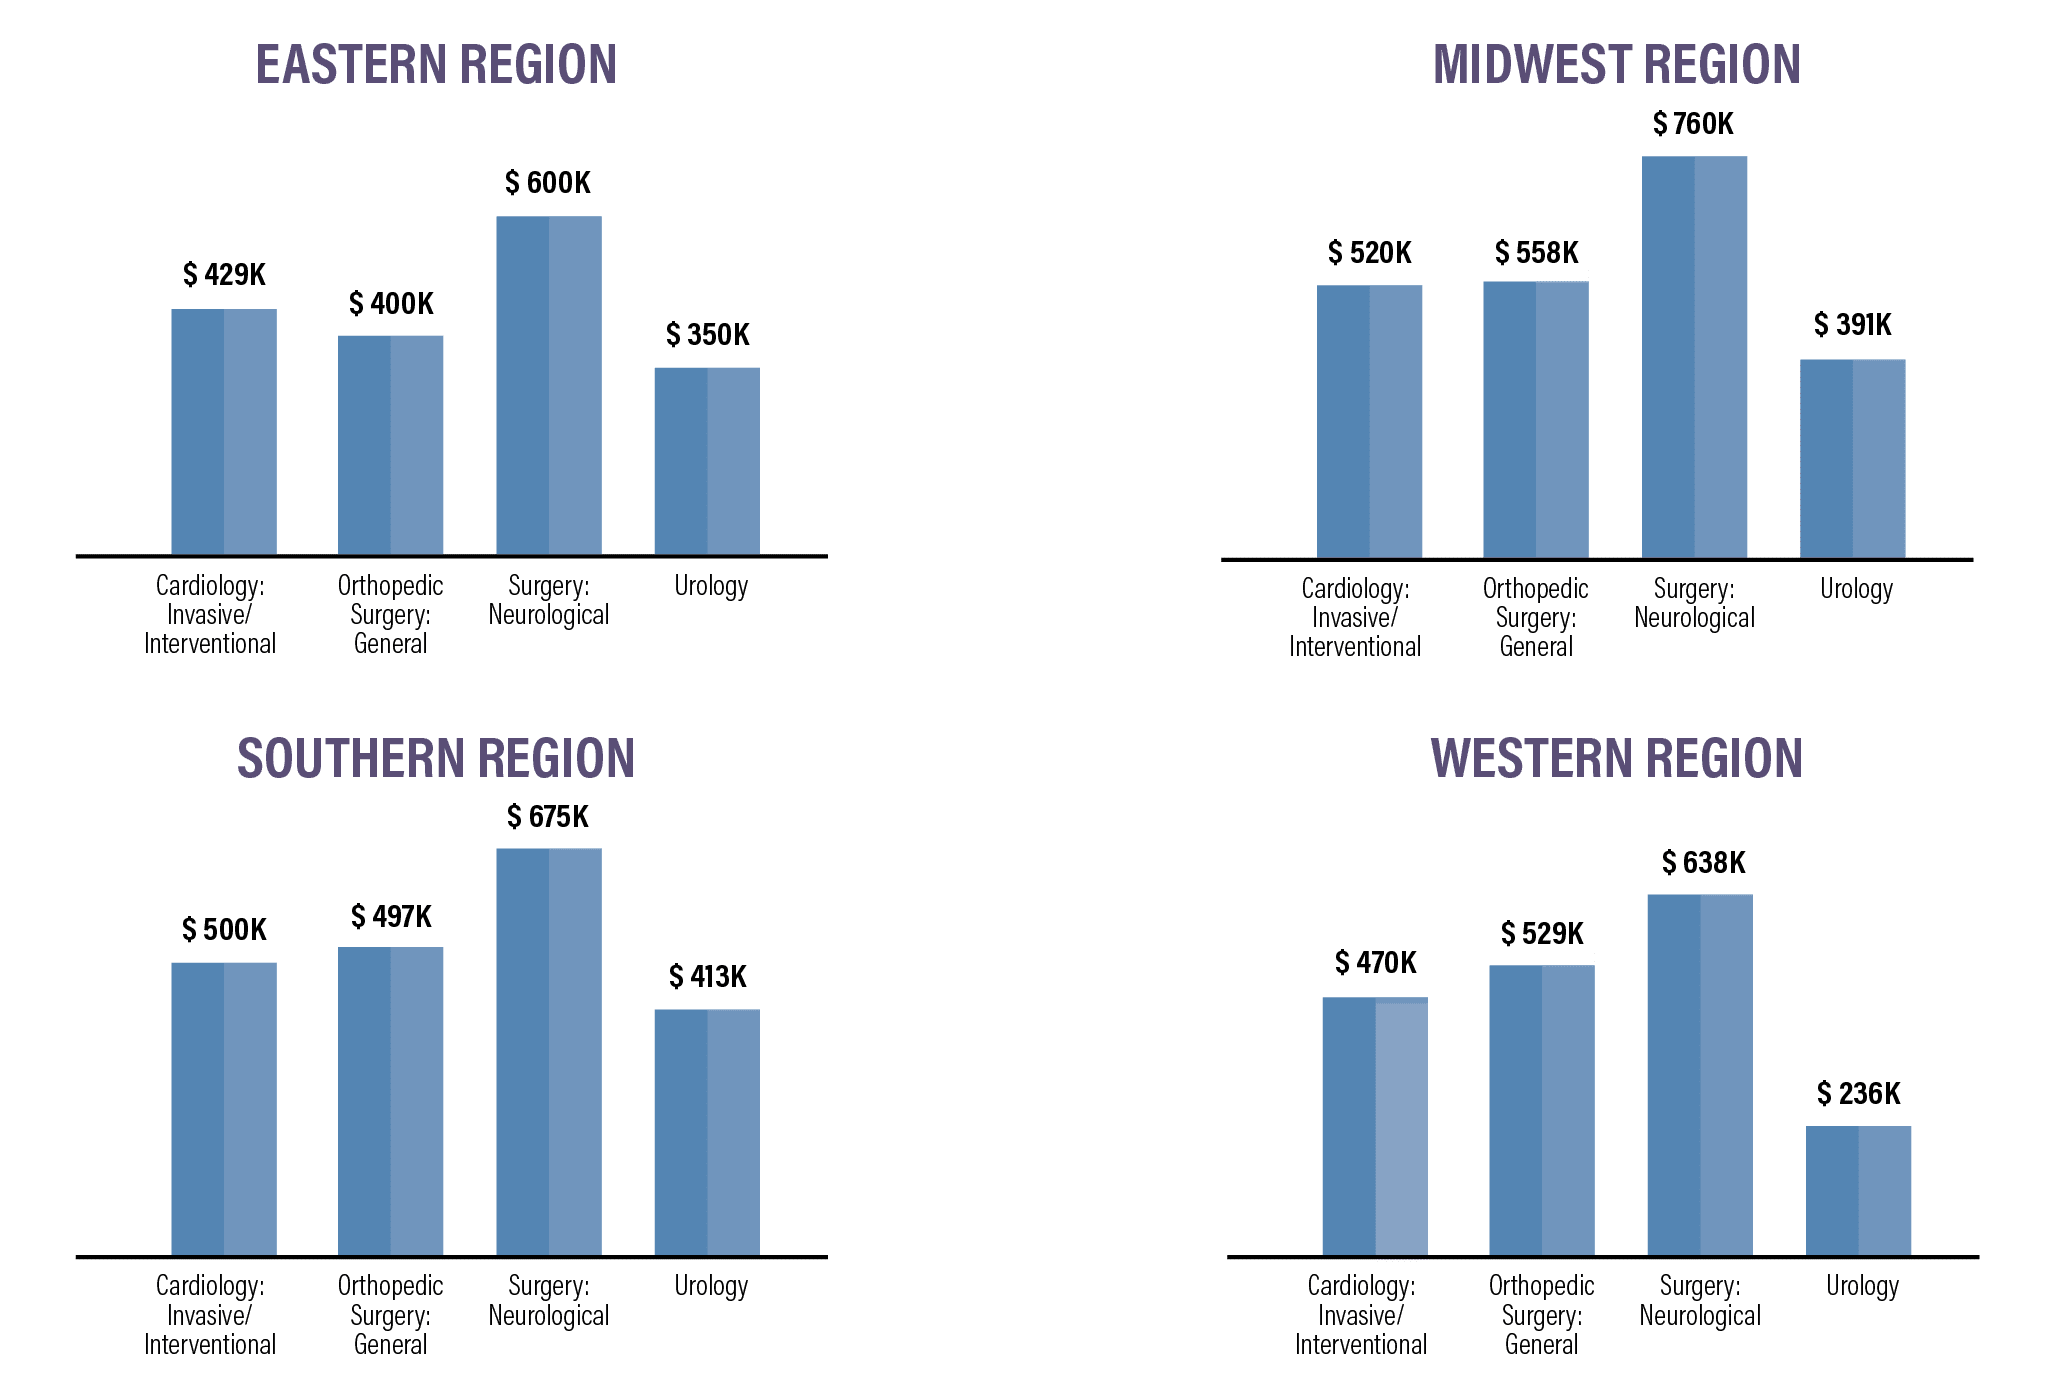
For physicians in four high-paying specialties, median salaries vary significantly, depending on the region in which they work:
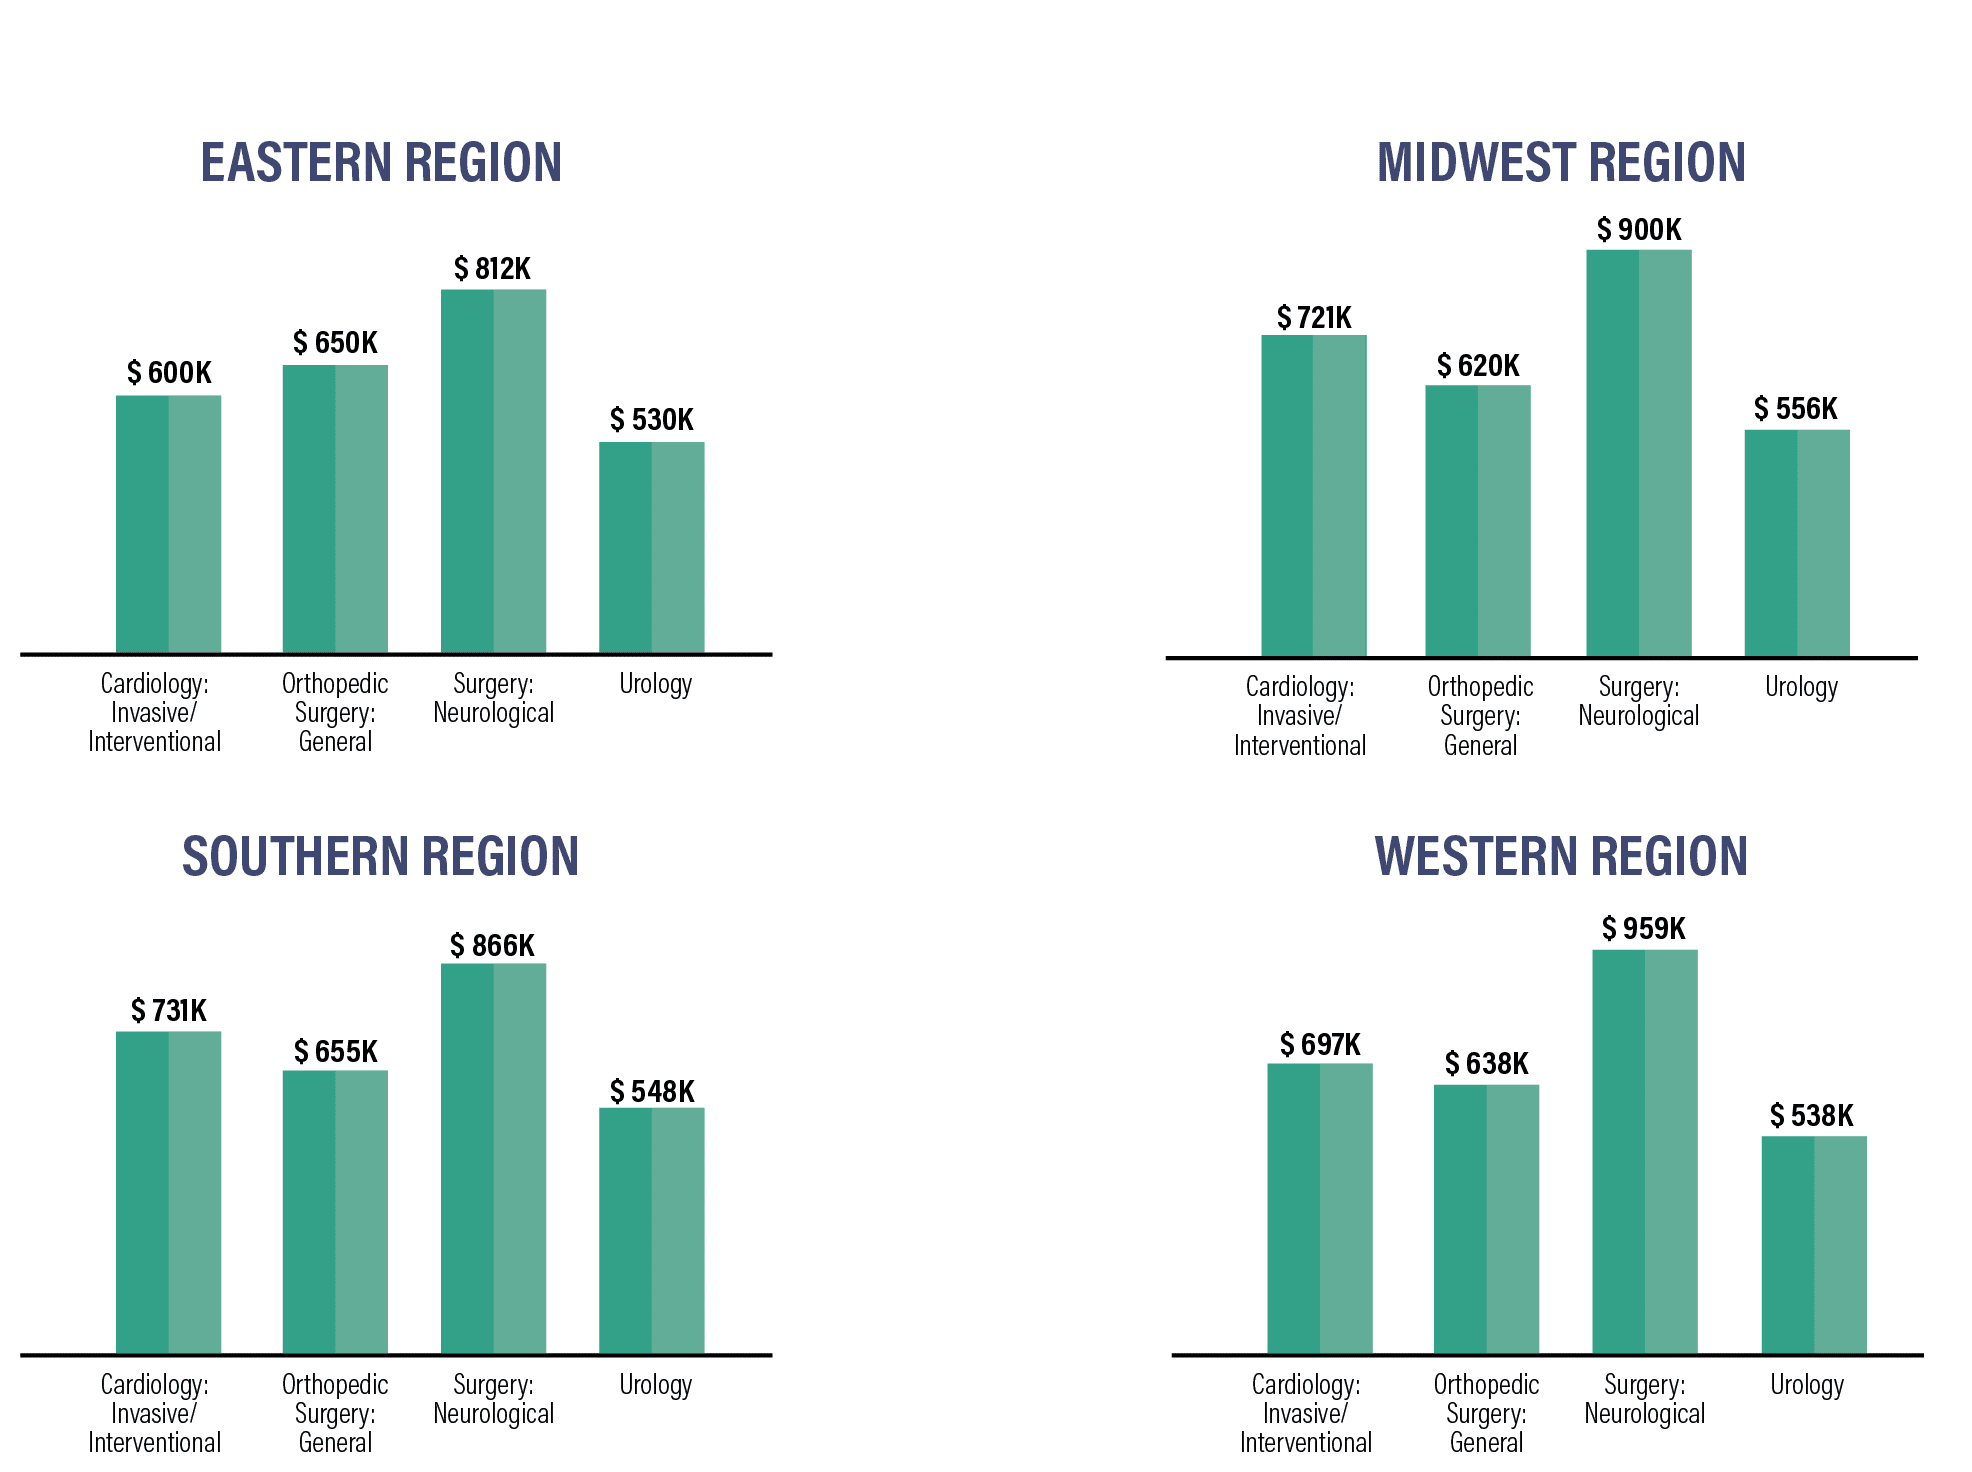
There is a wide variation in median pay rates between specialties and regions. Whereas neurologists in the West earn median pay of more than $950,000 for example, their median pay is nearly $100,000 less in the Southern region, and more than $100,000 less in the East. In contrast, median pay for urologists varies less than $25,000 no matter which region they live and work in.
Compensation by Specialty
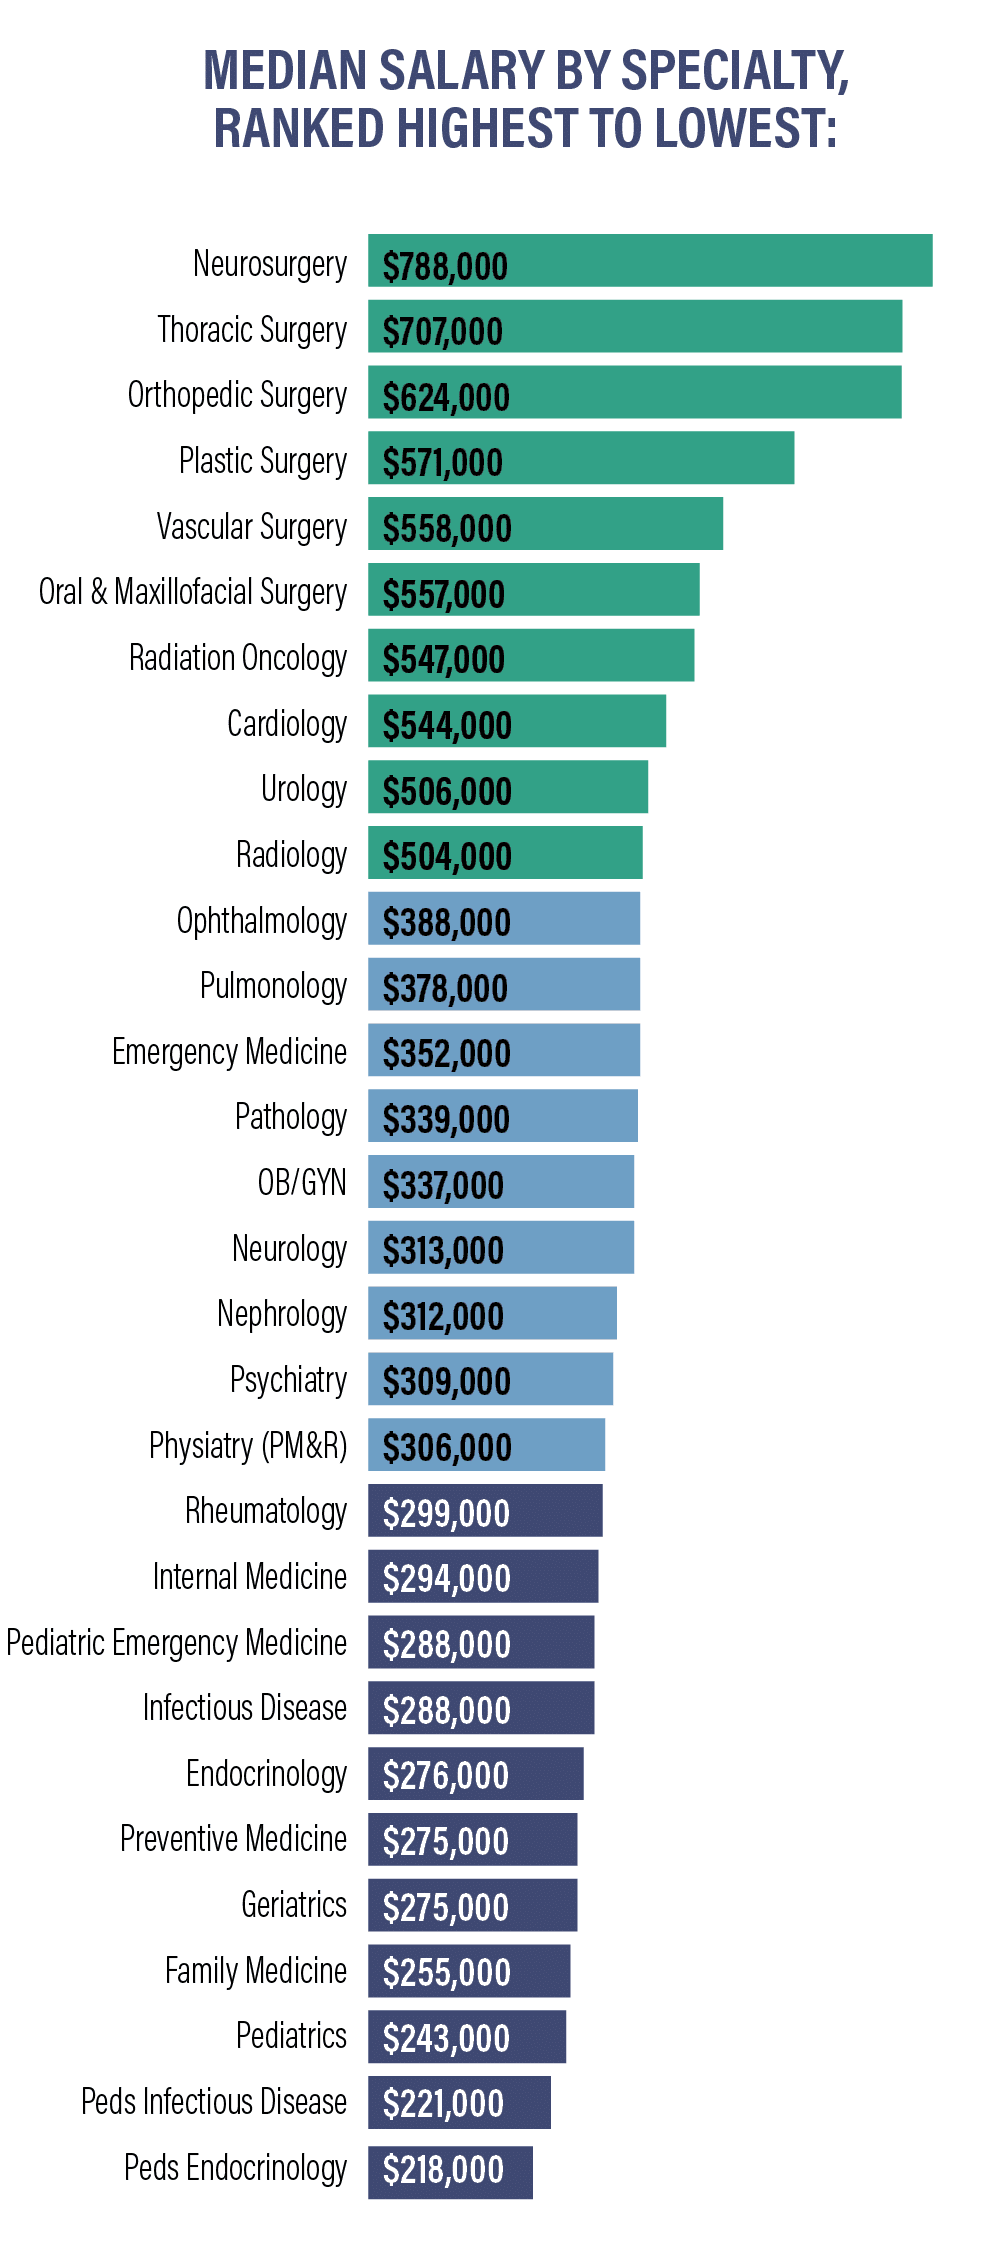
Family Medicine physicians earned an average of $255k in 2023, a 1.5% increase over 2022—this is the second time it has recorded the highest historical average to date. Surgeons as a group are the highest-earning specialists, with median pay of $347,870 in 2023.
Viewed by specialty, physicians have a wide range of median compensation, ranging from $218,266 for pediatric endocrinologists to $788,000 for neurosurgeons.
Specialties with the biggest salary increases:
- Oncology +6.2%
- Pediatric Infectious Disease +4.9%
- Pediatric Rheumatology +4.2%
- Preventive Medicine +4%
- Pulmonology +3.9%
Specialties with the biggest salary decreases:
- Opthalmology -7%
- Emergency Medicine -6%
- Physiatry (PM&R) -5%
- Allergy & Immunology -5%
- Rheumatology -3%
On average, neurosurgeons, thoracic surgeons, and orthopedic surgeons are the highest paid specialties, closely followed by plastic surgeons and vascular surgeons. Other specialties, including radiology, urology, and cardiology, earn over $500,000 a year on average.
A group of specialties, including psychiatrists, pulmonary medicine, OB/GYN, emergency medicine physicians, and radiologists, earn between $300,000 and $400,000 annually.
Pediatrics, geriatrics, preventive medicine, and internal medicine physicians all earn an average of between $200,000 and $300,000 a year.
Compensation by Gender
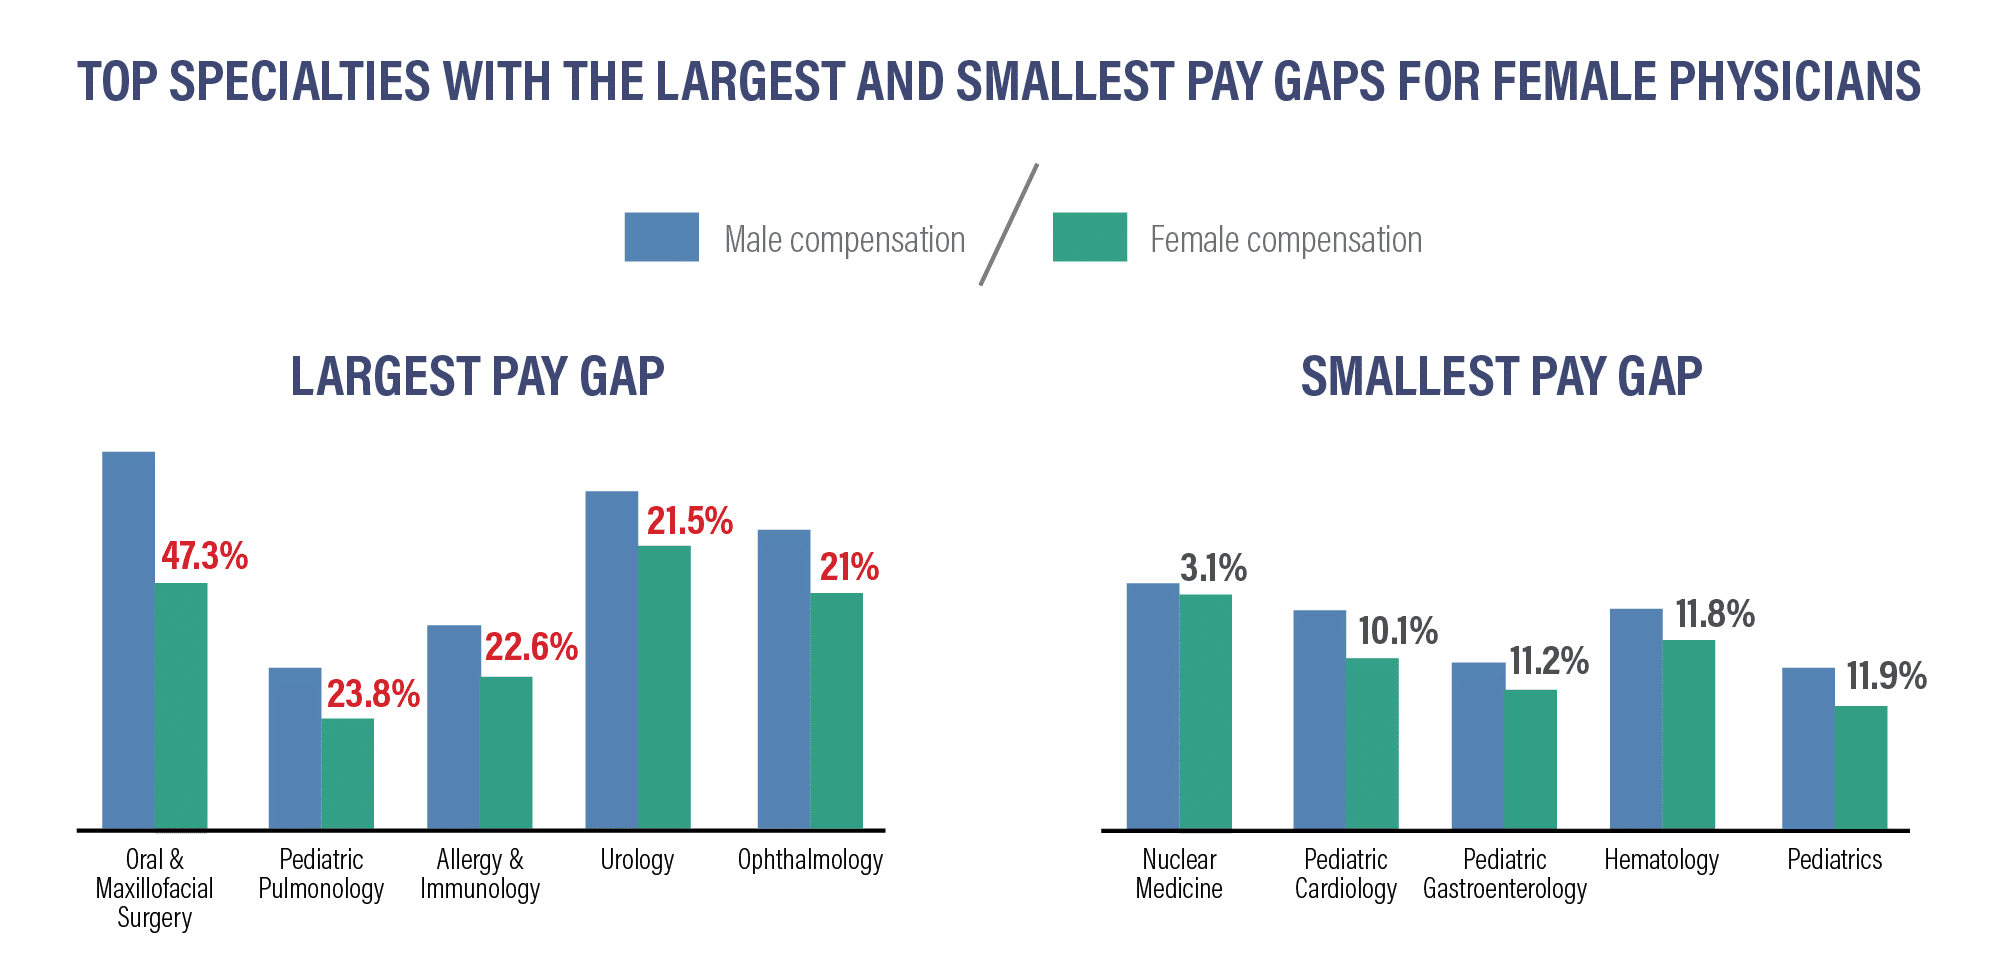
As we see with many professions, there is a gender pay gap between male and female physicions in the U.S.
Among primary care physicians, women earn about 16% less than men PCPs. This pay gap has narrowed: in 2020, female PCPs earned 22% less than their male counterparts. In 2020, female PCPs earned $211,000 on average, while men earned $269,000. In 2023, female PCPs averaged $239,000 in annual salary, compared to male PCPs’ $286,000.
Among all specialists, men earned $415,000 annually on average, compared to women specialists, averaging $327,000 a year.
The overall pay gap between male and female physicians has also narrowed, if only by a small amount. In 2022, the pay gap was 28%, declining to 26% in 2023.
Specialties with the largest gender wage gaps:
- Oral & Maxillofacial Surgery: women earn 47.3% less: $568k / $395k
- Pediatric Pulmonology: women earn 23.8% less: $282k / $227k
- Allergy & Immunology: women earn 22.6% less: $329k / $268k
- Urology: women earn 21.5% less: $515k / $424k
- Ophthalmology: women earn 21% less: $468k / $387k
Specialties with the smallest gender wage gaps:
- Nuclear Medicine: women earn 3.1% less: $394k/$382k
- Pediatric Cardiology: women earn 10.1% less: $344k/$303k
- Pediatric Gastroenterology: women earn 11.2% less: $293k/$264k
- Hematology: women earn 11.8% less: $358k /$320k
- Pediatrics: women earn 11.9% less: $283k /$253k
Overworked by Gender
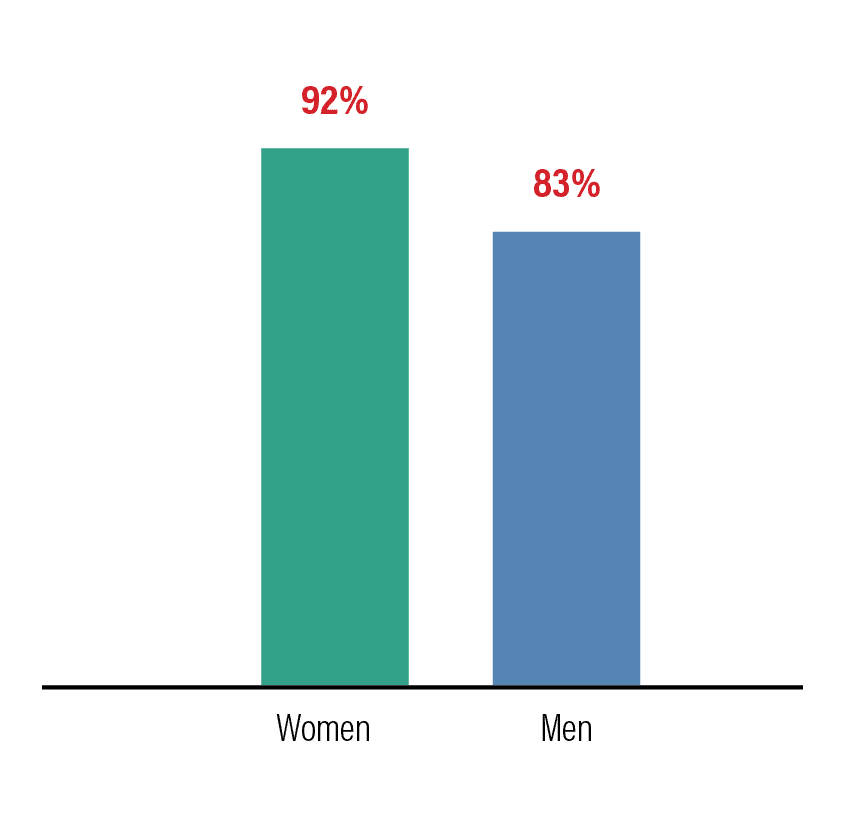
Workloads and stress also play a role in gender equity. Women physicians report more concerns with overwork than men. Only 8% of women physicians responded to national surveys that they were not overworked, while 17% of men said “I’m not overworked.”
Over 70% of women and 60% of men physicians said that “because of overwork, I’m considering early retirement, looking at another career, or looking for another employer.”
Related: How Female Physicians can Counteract the Gender Pay Gap
Compensation Bonuses
Physicians continue to earn bonuses in both primary care roles and specialties. The average signing bonus for physicians was $37,473 in 2023, an increase of 20% over the previous year. RVU-based compensation continues to remain the most common method for calculating bonuses, followed by bonuses based on net collections. Bonuses based on quality have continued to decline in importance, at 25% as compared to a high of 64% in 2019/2020.
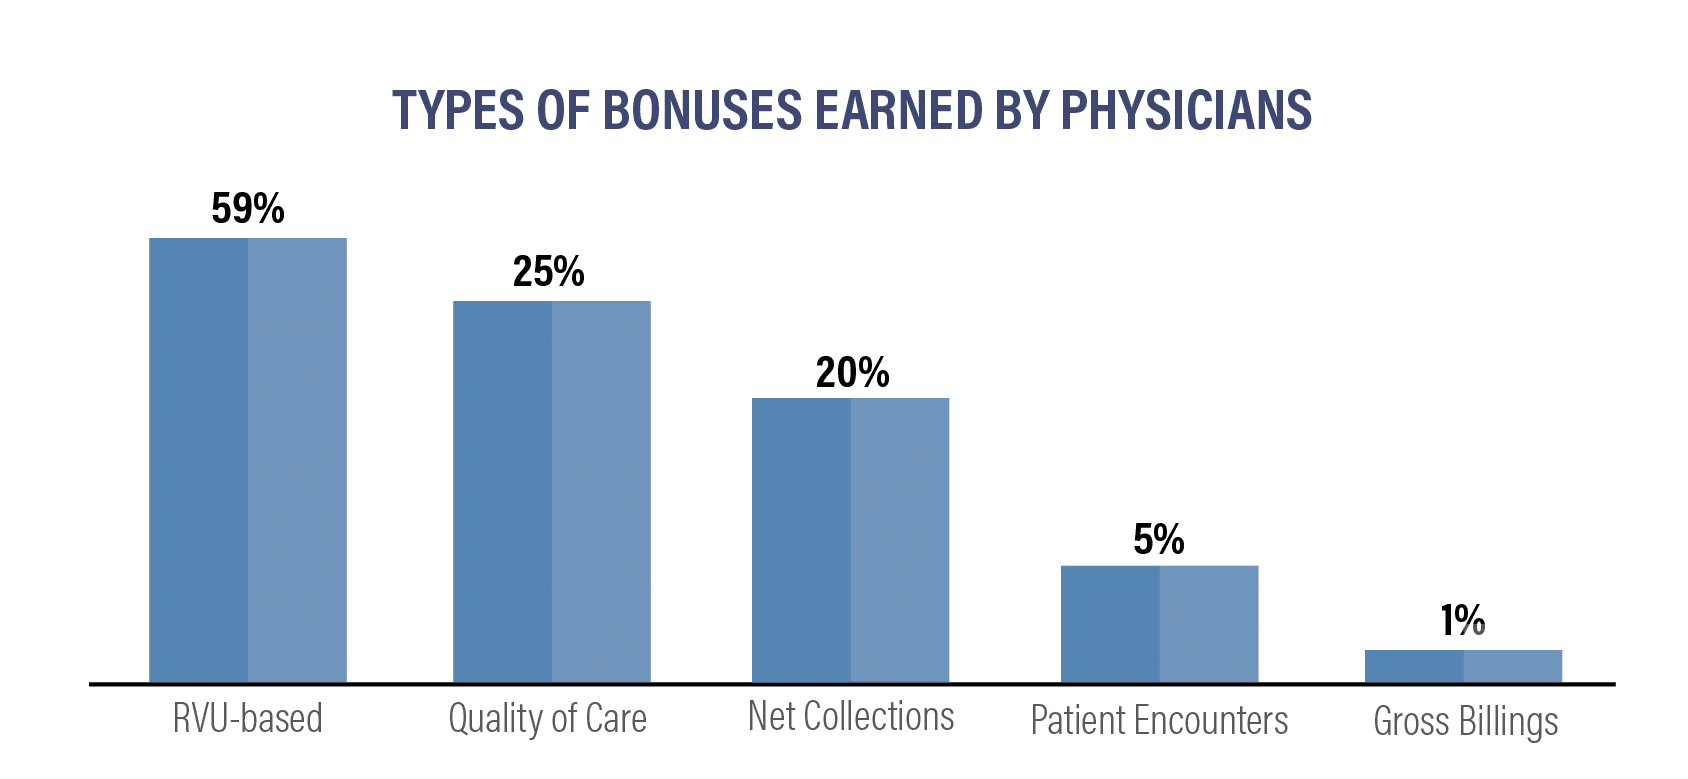
In 2023, here’s how bonuses compared to the previous year:
- RVU-based: 59% (downfrom 70% last year)
- Quality of Care: 25% (downfrom 26% last year)
- Net Collections: 20% (up from 18% last year)
- Patient encounters : 5% (downfrom 9% last year)
- Gross Billings: 1% (downfrom 3% last year)
Top 11 Average Incentive Bonuses by Specialty:
- Orthopedics/Orthopedic Surgery: $134k (up from $126k last year)
- Cardiology: $88k (upfrom $85k last year)
- Radiology: $80k (upfrom $66k last year)
- General Surgery: $75k (upfrom $46k last year)
- Anesthesiology: $68k (same as last year)
- OB/GYN: $57k (upfrom $49k last year)
- Emergency Medicine $37k (down from $54k last year)
- Psychiatry: $37k (upfrom $35k last year)
- Family Medicine: $34k (upfrom $30k last year)
- Internal Medicine: $33k (upfrom $29k last year)
- Pediatrics: $31k (upfrom $28k last year)
Physicians are reporting that they are working longer and harder than ever to receive incentive bonuses. On an individual basis, 57% of specialists reported earning an incentive bonus in 2022. Amongst PCPs, 53% received an average incentive bonus of $31k.
Average Incentive Bonus by Specialty:
As healthcare organizations continue to grow and evolve, some practices and employment settings have seen more growth in salaries than others. While multi-specialty groups have increased their compensation significantly in recent years, these organizations as well as single specialty groups did not increase compensation in 2023. Solo practices and HMOS did increase their compensation during the prior year:
- Multi-specialty group: -0.7%
- Health Maintenance Organization: 3.4%
- Industy/Phramaceutical: -0.8%
- Health System/IDN/ACO: 1.4%
- Single specialty Group: -0.7%
- Urgent Care Center/Chain: -1%
- Solo Practice: 3%
- Academic: -0.9%
- Hospital: -0.1%
- Government: 1.8%
Related: When Physicians Should Walk Away From a Job Offer
Compensation Trends Summary
Here are some the takeaways:
- Primary care physicians earned an average of $265,000 in 2023, up from $260,000 in 2022.
- Specialists earned an average of $382,000 in 2023, up from $368,000 in 2022.
- Neurosurgeons, thoracic surgeons, and orthopedic surgeons are the three highest earning specialties, closely followed by plastic surgeons.
- By percentage, the biggest salary increases are in oncology and pediatric specialties.
- The biggest salary decreases are in ophthalmology and emergency medicine.
- On average, female physicians earn 21% less than male physicians in the same specialty, representing a 4% closure of the male-female pay gap in one year.
- 57% of specialists earned an incentive bonus.
- 59% of PCPs earned an incentive bonus.
- Health Maintenance Organizations saw the biggest growth of any practice setting, at 3.4%, and solo practices also grew by 3%.
- Several practice settings, including single specialty groups, multi-specialty groups, and academic organizations, declined in compensation over the past year.
Hiring Trends
Hiring trends are changing with greater frequency as the population grows and health systems and practice models evolve. Different regions also require different specialties or primary care physicians.
We’ve compiled data from medical recruiting firms and other sources to create a breakdown of hiring trends based on specialty, region, and medical setting.
Hiring Trends by Specialty
In addition to the specialties in high demand, there have been more placement searches for advanced practitioners, including nurse practitioners (NPs) and physicians assistants (PAs) than there have been for primary care physicians. Family physicians were the second-most recruited group around the country last year. Among physician specialists, recruitment demand continues to be strong, with 64% of placements requested for in-demand specialties.
Top 10 Most Recruited Physicians:
- Family Medicine
- Radiology
- OB/GYN
- Anesthesiology
- Psychiatry
- Internal Medicine
- Gastroenterology
- Cardiology
- Hematology/Oncology
- Neurology
While psychiatrists were recruited following the COVID-19 pandemic and remain in demand, they dropped from fourth place last year to sixth place in recruitment efforts. There is still a continuing shortage of physicians across the board and a projected shortage of all physicians and specialties through 2025.
Projected deficit of physicians through 2034:
By 2034, there will be a shortage of between 37,800 and 124,000 physicians. Depending on different care and planning scenarios, there could be a shortage of between 17,800 and 48,000 primary care physicians
- Primary Care: Between 17,800 and 48,000
- Medical Specialists: 16,800
- Surgery 13,900
- Other (including NPs): 26,400
- Hospitalists: 1,900
By 2034, the overall shortage of physicians in the United States could be as great as 124,000. Of that 124,000, approximately 48,000 will be primary care physicians and 76,000 are specialists, spread out among a wide variety of specialities.
Hiring Trends by Region
The East coast and the majority of large metro areas throughout the nation have the greatest number of trained physicians. Midwestern and Southern states, along with rural areas, continue to confront large aging populations with greater needs for care, and they also have a greater shortage of trained practitioners. Hiring surveys show that areas with a shortage of physicians continue to offer higher salaries and larger bonuses to attract qualified candidates. Shifts in care models are also affecting recruitment and hiring, including continued growth in urgent care clinics and telehealth, as well as continued reliance on advanced practioners (AP), including nurse practitioners and physicians assistants.
Recruitment trends by employment setting have shifted over the past year. They include:
- Hospital recruitment: 35% in 2023 (up from 34% in 2022)
- Medical group recruitment: 24% in 2023 (up from 18% in 2022)
- Academic medical center recruitment: 31% in 2023 (down from 34% in 2022)
- Federally qualified health center recruitment: 5% in 2023 (down from 8% in 2022)
- Physician recruitment for solo, partnership, & concierge practices: 2% in 2023 (up from 1% in 2022)
Regardless of specialty, some employment settings offer higher salaries than others. Here’s how the average salary varies by employment setting for some of the top-earning specialties:
Orthopedic Surgery (General)
- Single-specialty: $526k
- Multi-specialty: $666k
- Rural Health Clinic: $671k
- Hospital Department Practice: $684k
- Academic Department: $457k
Cardiology (Invasive-Interventional)
- Single-specialty: $714k
- Multi-specialty: $693k
- Rural Health Clinic $694k
- Hospital Department Practice: $702k
- Academic Department: $693k
Urology
- Single-specialty: $535k
- Multi-specialty: $525k
- Rural Health Clinic $500k
- Hospital Department Practice: $514k
- Academic Department: $507k
Hiring Trends by Region
Each year, physician demand changes from metro region to metro region. When analyzing the number of job listings by region and area in 2022, Tallahassee, Florida and Springfield, Illinois had the greatest number of job listings for physicians in general, as well as for Locum Tenens physicians.
Metro Areas with Highest Demand for Physicians:
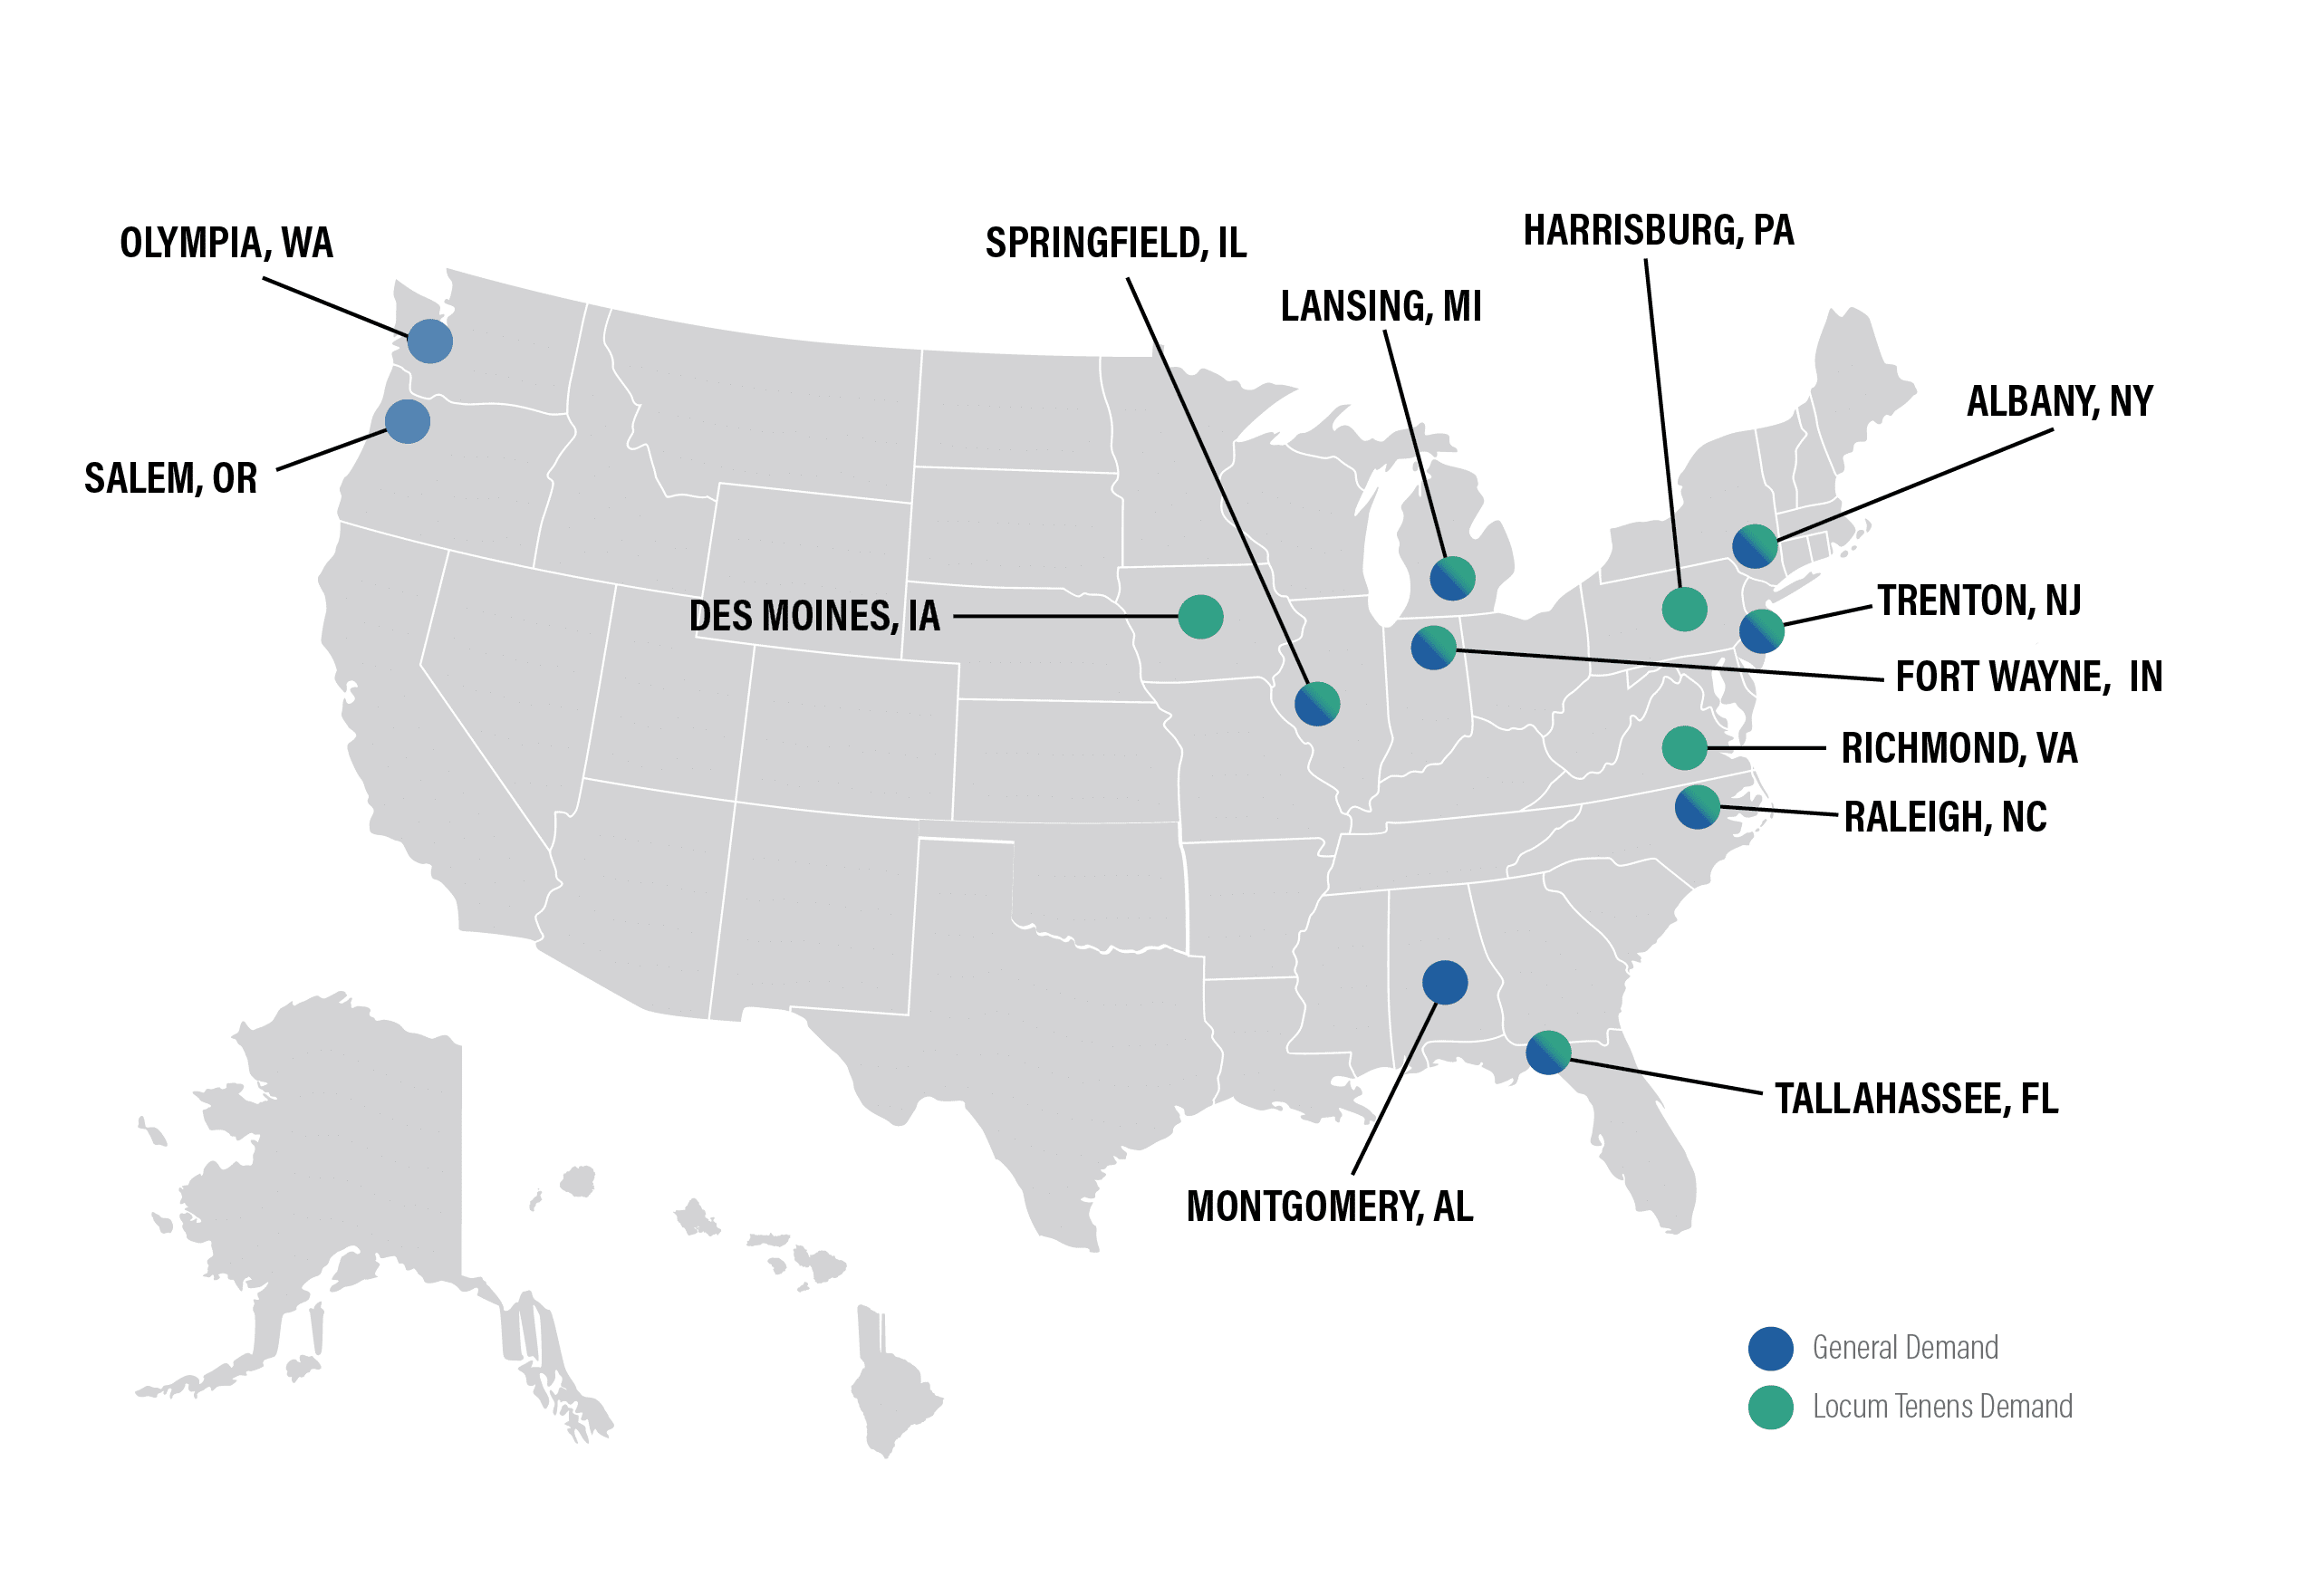
General Demand:
- Tallahasee, FL
- Springfield, IL
- Olympia, WA
- Montgomery, AL
- Salem, OR
- Fort Wayne, IN
- Albany, NY
- Trenton, NJ
- Lansing, MI
- Raleigh, NC
Locum Tenens Demand:
- Tallahasee, FL
- Springfield, IL
- Albany, NY
- Trenton, NJ
- Harrisburg, PA
- Raleigh, NC
- Lansing, MI
- Des Moines, IA
- Fort Wayne, IN
- Richmond, VA
The biggest factors causing physician shortages:
- Increased workloads and feelings of overwork are influencing more than 65% of current physicians, including over 70% of women and 60% of men.
- An aging population: the number of people 65 and older is expected to grow by 42% between now and 2034.
- Retirements: more than two out of five current physicians will be over age 65 between now and 2034.
- Burnout, stress, and overwork are having effects on physician shortages.
- Increasing use of APRNs and PAs has not improved physician shortages so far.
- Regional and geographic impacts are expected to continue in areas with more aging adults, particularly southern states including Florida, Georgia, and South Carolina.
- Telehealth and convenient care continue to influence hiring trends.
- Benefit offers for new hires continue to be reduced, with the exception of continuing medical education (CME) benefits, which are nearly universally provided at some level by all hiring organizations.
In 2022/23, 62% of new offers included relocation expenses, declining from 78% in the prior year.
CME offers remained relatively stable, with 93% of new offers receiving CME payments this year, up from 92% last year
Most other benefits are down across the board for new hires:
- Health Insurance: 65% (down from 68% last year)
- Malpractice: 63% (down from 66% last year)
- Retirement/401k: 58% (down from 61% last year)
- Disability: 57% (down from 61% last year)
- Educational Forgiveness: 18% (up from 16% last year)
Related: What’s Included in a Doctor’s Benefit Package?
Hiring Trends Summary
Here are the key takeaways:
- Physician shortages continue, and workplace volatility and burnout are on the rise.
- Nearly half of all new physician searches took place to replace a departing physician, representing a 16% increase since 2018.
- Family Physicians are still in demand, but are no longer the most-recruited type of physician.
- Even in high-demand specialties, salaries are volatile and responding to rapid changes in demographics and workforce across the U.S.
Ongoing Impacts of COVID-19 and Emerging Trends
COVID-19 continues to impact the healthcare industry, but emerging trends are joining the pandemic in affecting physician compensation and work satisfaction.
Essential specialties like OB/GYN and Family Medicine saw no increase in compensation during 2022 and 2023, and some specialties saw decreases, including Rheumatology, Physical Medicine & Rehabilitation, Nephrology, Emergency Medicine, and Opthalmology. Trends like telemedicine and “convenient care” which arose during the pandemic are continuing to grow.
Physicians noted that their reimbursement rates did not increase during the prior year, and many of them cited burnout, facility overcrowding, and delayed payment from insurance carriers as reasons for reduced compensation.
In particular, Medicare reimbursement cuts are reducing bonuses and incentives for PCPs and specialists alike.
Covid Effects in 2023:
- Senior citizens have been reluctant to return to medical offices following the COVID-19 Pandemic
- Return-to-office mandates also took full effect during 2023.
Other Trends in Work and Compensation:
- 20% of physicians said they did other medical-related work to supplement their income
- 11% of physicians engaged in “moonlighting” from their primary roles
- 7% of physicians added hours to their primary job
- 62% did not do any outside work to supplement their income
- 9,000 physicians reported “burnout” – an increase of more than 10% since 2018
- 23% of physicians reported being depressed – an increase of 8% since 2018
- 65% of Emergency Medicine physicians are experiencing burnout
- 59% of Pediatricians are experiencing burnout
Would Physicians Choose the Same Specialty Again?
Just as they did in 2023, 73% of physicians said they would choose to work in medicine again, while 27% said they would not. Of those who would choose to work in medicine again, the majority of specialists are satisfied with their choice of specialty.
Physicians Most Likely to Choose the Same Specialty Again:
- Orthopedics: 95% (down from 97% last year)
- Plastic Surgery: 97% (up from 96% last year)
- Gastroenterology: 92% (down from 95% last year)
- Ophthalmology: 92% (down from 94% last year)
- Dermatology: 90% (down from 99% last year)
- Radiology: 90% (down from 92% last year)
- Urology: 96% (up from 90% last year)
Physicians Least Likely to Choose the Same Specialty Again:
- Pulmonary Medicine: 76% (down from 79% last year)
- OB/GYN: 76% (same as last year)
- Emergency Medicine: 74% (same as last year)
- Nephrology: 72% (down from 73% last year)
- Public Health & Preventative Medicine: 71% (down from 79% last year)
- Family Medicine: 66% (down from 68% last year)
- Internal Medicine: 61% (down from 63% last year)
How Many Hours Are Physicians Working?
Every medical specialty works more than 40 hours a week, with most averaging more than 50 hours a week. Critical care specialists work nearly 60 hours a week, while general surgeons, cardiologists, nephrologists, and urologists all average more than 54 hours a week. Allergists and immunologists and dermatologists work the lowest number over hours, slightly more than 44 a week. Emergency medicine physicians work 44.4 hours a week on average, but the high stress they experience likely makes their shifts seem longer.
Time Spent on Patient Care versus Paperwork:
Physicians are spending an average of 16 hours per week on paperwork and administration. Different specialties are required to spend more time on paperwork than others.
Physical medicine and rehabilitation specialists spend 19 hours a week on paperwork and administration, and critical care specialists spend 18 hours a week.
Other specialties, like cardiology, diabetes and psychiatry, spend 16 hours a week. Anesthesiologists spend 9 hours a week on paperwork vs. patient care.
Are Physicians Happy?
Many physicians feel that their work is rewarding, although burnout and overwork is a growing factor in job satisfaction and overall happiness.
More than 35% of physicians in one survey said that they were considering early retirement, and another 16% said they were considering another career.
In the same survey, only 13.7% of physicians said they were not overworked. Among this group, 19.6% said they were overworked, but planning to stay at the same job.
Aspects of the job that physicians find the most rewarding:
- Being very good at what I do: 30%
- Gratitude/relationships with patients: 24%
- KNowing I’m making the world a better place: 19%
- Making good money at a job I like: 10%
- Pride in being a doctor: 5%
- Teaching: 5%
- Nothing: 4%
- Other: 2%
Aspects of the job that physicians like the least:
- Having so many rules and regulations: 21%
- Working long hours: 16%
- Difficult patients: 15%
- Difficulty getting reimbursement: 13%
- Working with an EHR system: 13%
- Other: 10%
- Worrying about being sued: 7%
- Nothing: 3%
- Danger/risk of treating COVID-19 patients: 1%
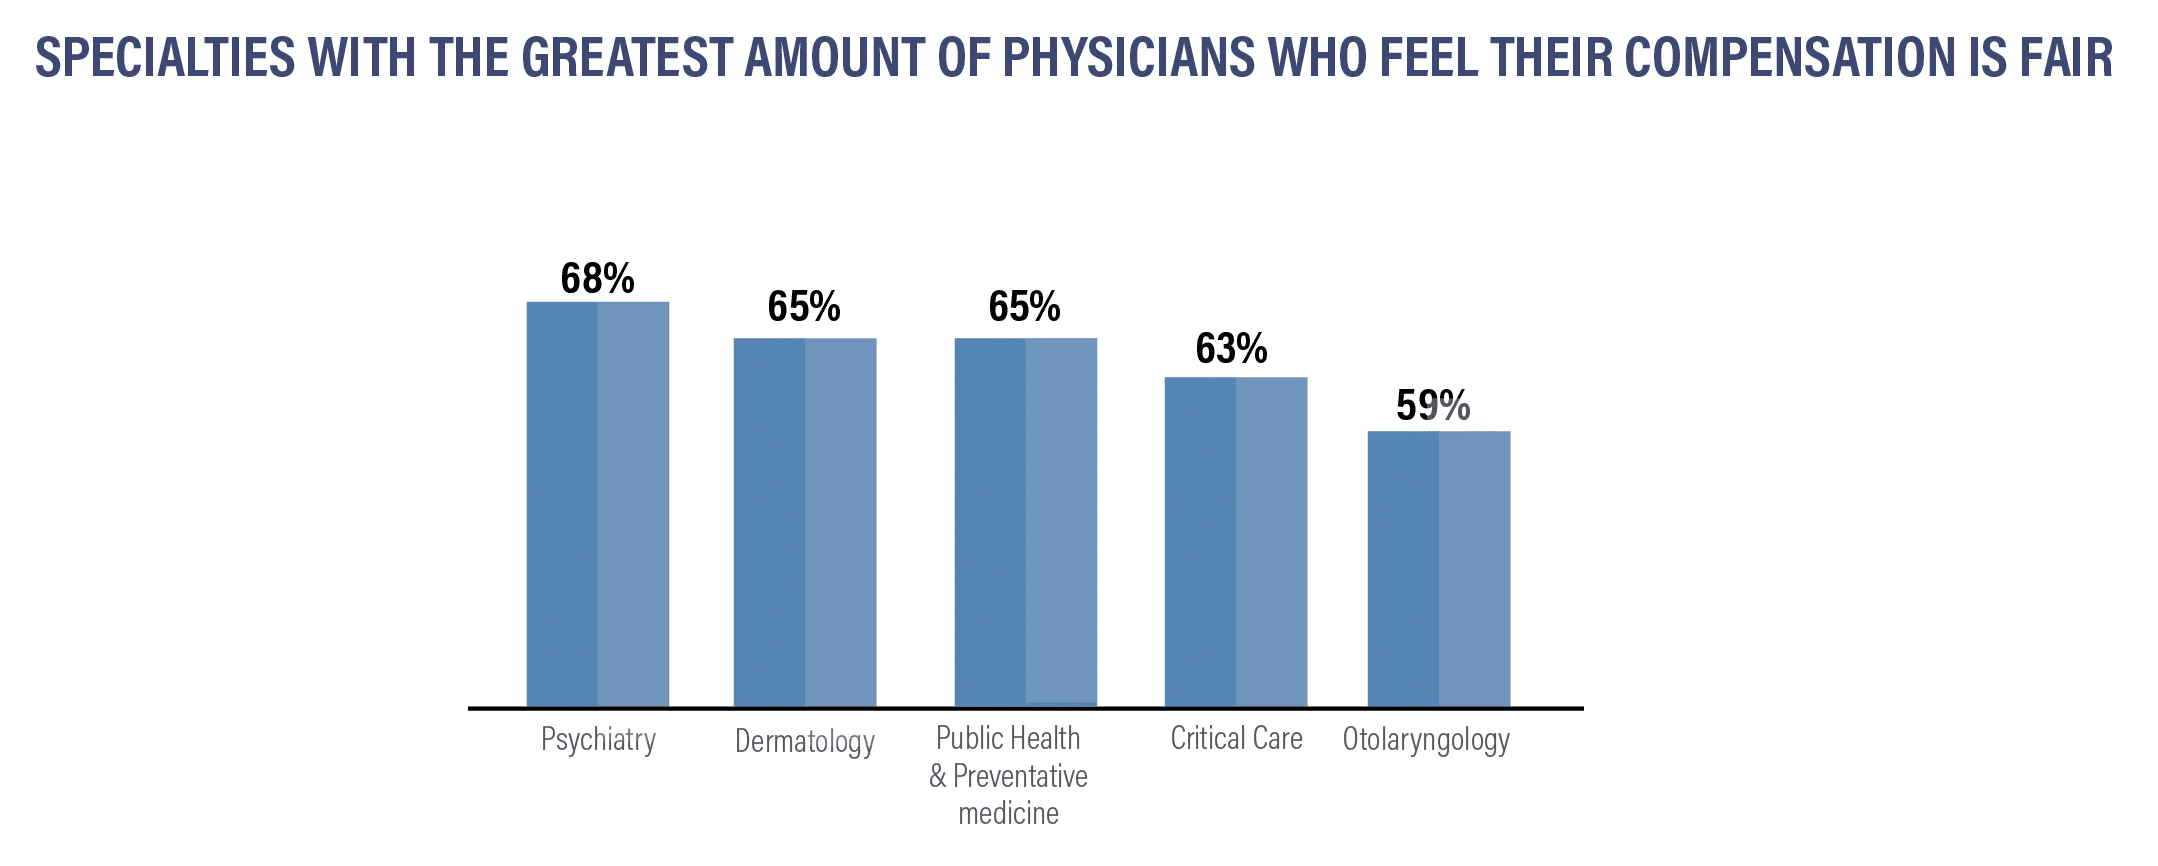
Specialties with the Greatest Amount of Physicians Who Feel Their Compensation is Fair:
- Psychiatry: 68%
- Dermatology: 65%
- Public Health & Preventative Medicine: 65%
- Critical Care: 63%
- Otolaryngology: 59%
Specialties Who Do NOT Believe They are Fairly Compensated:
- Orthopedics: 49%
- Pulmonary Medicine: 48%
- Pediatrics: 45%
- Diabetes & Endocrinology: 46%
- OB/GYN: 45%
- Nephrology: 43%
- Internal Medicine: 43%
- Ophthalmology: 42%
- Infectious Disease: 35%
A growing number of physicians are experiencing burnout and stress. Physicians continue to work long hours, and industry change is ongoing. Many physicians are asked to work with difficult-to-use and time-consuming EHR systems and cope with staff shortages.
A growing number of physicians report they are willing to accept differing compensation packages to achieve a better work-life balance. One-third have already negotiated differing compensations to improve their work-life balance, and another 36% say they would consider it.
Physicians can discover their options and work with professionals to obtain the compensation they want and sign contracts that can improve their job satisfaction.
Ready to finalize your first physician contract? Exploring job opportunities in a different state? Curious about how your incentives and bonuses compare to those offered to physicians in your specialty or elsewhere?
This report presents the latest insights into compensation and hiring patterns, aiding physicians in accessing industry insights and evaluating their prospects at any career stage.
The data presented represent averages and are subject to fluctuations. For a comprehensive understanding of your worth relative to the fair market standards in your field and area, consult with our skilled contract review professionals. Your salary and benefits packages are open to negotiation.
For assistance in securing a contract review specialist, exploring retirement, financial planning, discovering innovative tax-saving strategies, or safeguarding your finances with disability insurance or life insurance, reach out to Physicians Thrive today.
SOURCES FOR THIS REPORT INCLUDE:
- Bureau of Labor Statistics Occupational Outlook Handbook
- Doximity 2023 Physician Compensation Report
- Salary.com
- Merrit Hawkins 2023 Review of Physician and Advanced Practitioner Recruiting Incentives
- Medscape 2023 Compensation Overview
- The Complexities of Physician Supply and Demand: Projections from 2019 to 2034 (AAMC)
- Medical Group Management Association (MGMA)
Interested in our 2023 Compensation Report? Keep Scrolling!
Interested in a Compensation Review?
Get a leg up on your competition by finding out how your compensation stacks up against others.
Resources
2023 Physician Compensation Report

No matter where they practice or what their specialty is, physicians want and need to know how their salary compares to others.
The 2023 Physician Compensation Report Answers Questions About:
- Which physicians are highest-paid?
- Can moving to a new city or state increase your compensation?
- How does your specialty compare to other specialities and their compensation?
- Are there biases in compensation?
- Which are the highest-demand specialities?
- Which regions of the country are hiring the most?
- Where are physicians being offered the biggest bonuses?
We have saved you the trouble of spending countless hours sifting through expensive compensation reports that consist of hundreds of pages, as we have already done the hard work for you.
Our annual physician compensation report will save you time and money looking for the data and statistics you want to know.
HERE’S WHAT WE DETAIL IN THIS REPORT:
- How physicians in different medical specialties and regions of the United States are being compensated
- The gender wage gap
- How much physicians are earning in incentives
- Which specialties are in the greatest demand
We’ve compiled data from nearly a dozen different sources using current information to offer you the free Physicians Thrive 2023 Physician Compensation Report.
The Free Physicians Thrive 2023 Physician Compensation Report
Physicians’ salaries vary by region, specialty, gender, and a variety of other factors. From year to year, we see increases in certain regions, for certain specialties, and increasing bonuses in areas where there is a high demand for physicians.
We’ve broken down the compensation trends for physicians by specialty, region, gender, and by bonus incentives to provide insight into where salaries are increasing and where they’re decreasing.
Compensation by Region
Some of the same metro areas in the Northeast and South which have larger numbers of medical professionals and institutions, continue a trend of lower salaries.
Last year some lower-paying areas did increase pay, and now appear on the list of the top ten metro areas by percentage of pay increase. Rural areas also continue to pay some of the highest salaries in the country to attract medical professionals.
There are, however, some mid-sized metro areas that saw a salary increase. Buffalo and Boston saw significantly increased salaries. St. Louis, Virginia Beach, and Charlotte, NC all saw double-digit salary increases.
Metro areas with the biggest salary increases:
- Charlotte +12.9%
- Virginia Beach +12.1%
- St. Louis +10.5%
- Tampa +8.1%
- Hartford +7.8%
- Buffalo +7.4%
- Sacramento +7.1%
- Orlando +7.0%
- Nashville +6.9%
- Boston +6.1%
Metro areas that pay the highest salaries:
- Charlotte: $462,760
- St. Louis: $452,219
- Buffalo: $426,440
- Jacksonville: $425,706
- Orlando: $425,634
- Minneapolis: $425,059
- Milwaukee: $422,735
- Phoenix: $419,359
- Dallas: $415,487
- Los Angeles: $414,925
Metro areas that pay the lowest salaries:
- Baltimore: $330,917
- Providence: $346,092
- San Antonio: $355,439
- Washington DC: $356,633
- Boston: $363,545
- Portland: $363,890
- Denver: $364,927
- Philadelphia: $373,765
- Birmingham: $375,074
- Detroit: $376,007
Los Angeles is the biggest metro area to join the highest-paying list this year. On the lower end of salaries, several cities saw significant pay increases, like Detroit and San Antonio, which was at the bottom of the list on our 2022 report. All higher-paying metro areas are over $400,000 a year in salary.
Lower-paying metro areas tend to have older healthcare infrastructures and declining populations. However, there are a few exceptions, including Denver, which is a younger, growing city. Eastern seaboard cities and some Southern cities continue to pay lower salaries and are losing population in favor of higher pay and improved housing costs in growing mid-sized cities in Florida, some parts of Texas, and the Midwest.
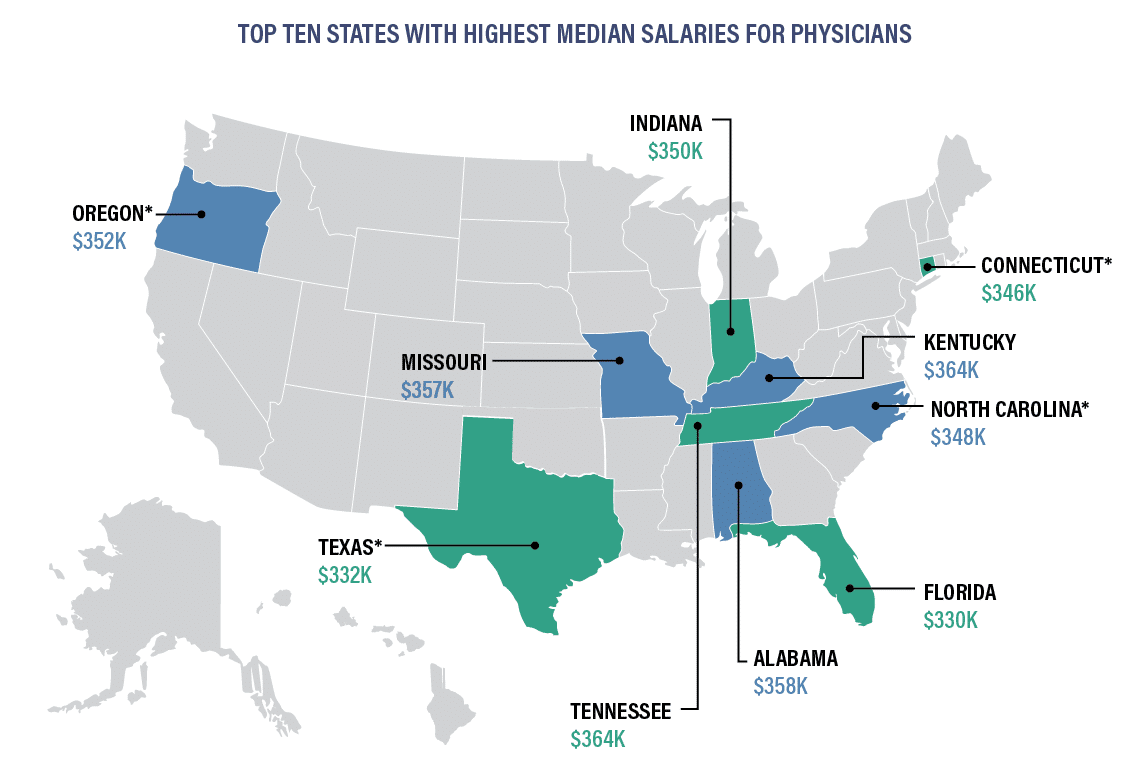
*Indicates states that are new to the top ten for 2023.
Oregon, North Carolina, Connecticut, and Texas join the Top Ten highest median salary states for 2023. Iowa, South Carolina, Oklahoma, and Georgia are no longer in the Top Ten.
For physicians in four high-paying specialties, median salaries vary significantly, depending on the region in which they work:
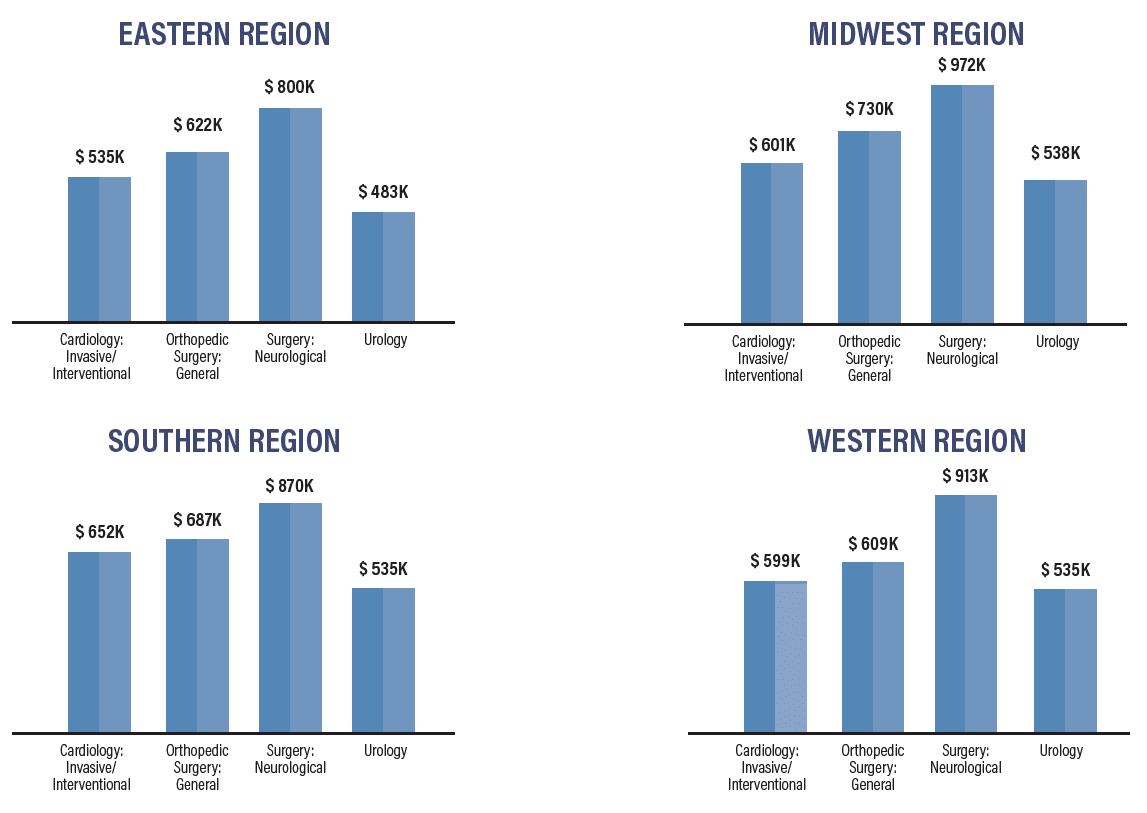
Median salaries in these specialties are beginning to show significant variations between specialty and regionally. However, East coast salaries continue to be lower on average than those in other regions.
There are a variety of reasons for this variation in pay, and higher concentrations of qualified physicians in the Eastern region continue to be a significant influence on median annual earnings for many specialties.
Compensation by Specialty
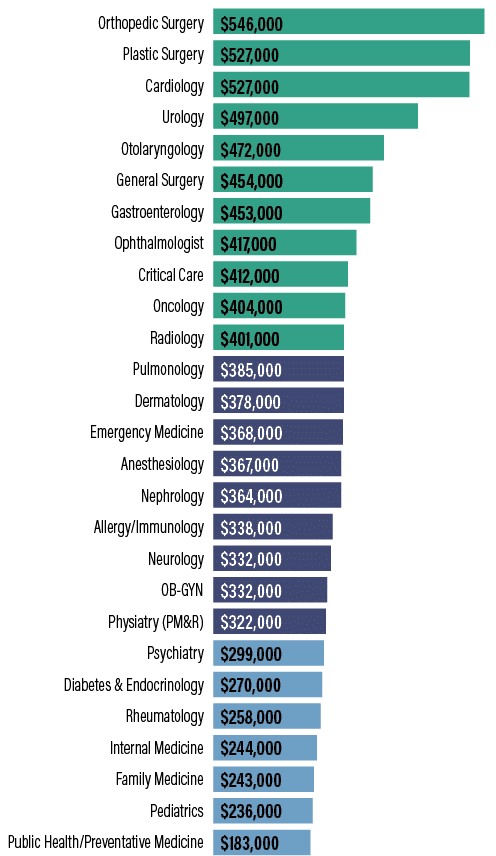
PCPs earned an average of $251k in 2022, a 3% increase over 2021—the highest historical average recorded to date. Grouped together, specialists earned an average of $351k in 2022, up from $344k in 2021.
Surgical specialists continue to be among some of the highest-paid professionals in medicine. Pediatricians and those who practice family medicine continue to be among the lowest-paid physicians.
Specialties with the biggest salary increases:
- Ob/GYN +14%
- Radiology +12%
- Anesthesiology +8%
- Cardiology +8%
- Neurology +7%
Specialties with the biggest salary decreases:
- Cardiology (Inv) -16%
- Dermatology -3%
- Pediatrics -3%
- Nonsurgical specialists-1%
- Surgical physicians-1%
Plastic surgeons, cardiologists and orthopedic surgeons remain among the highest-earning specialties with an average compensation over $500,000.
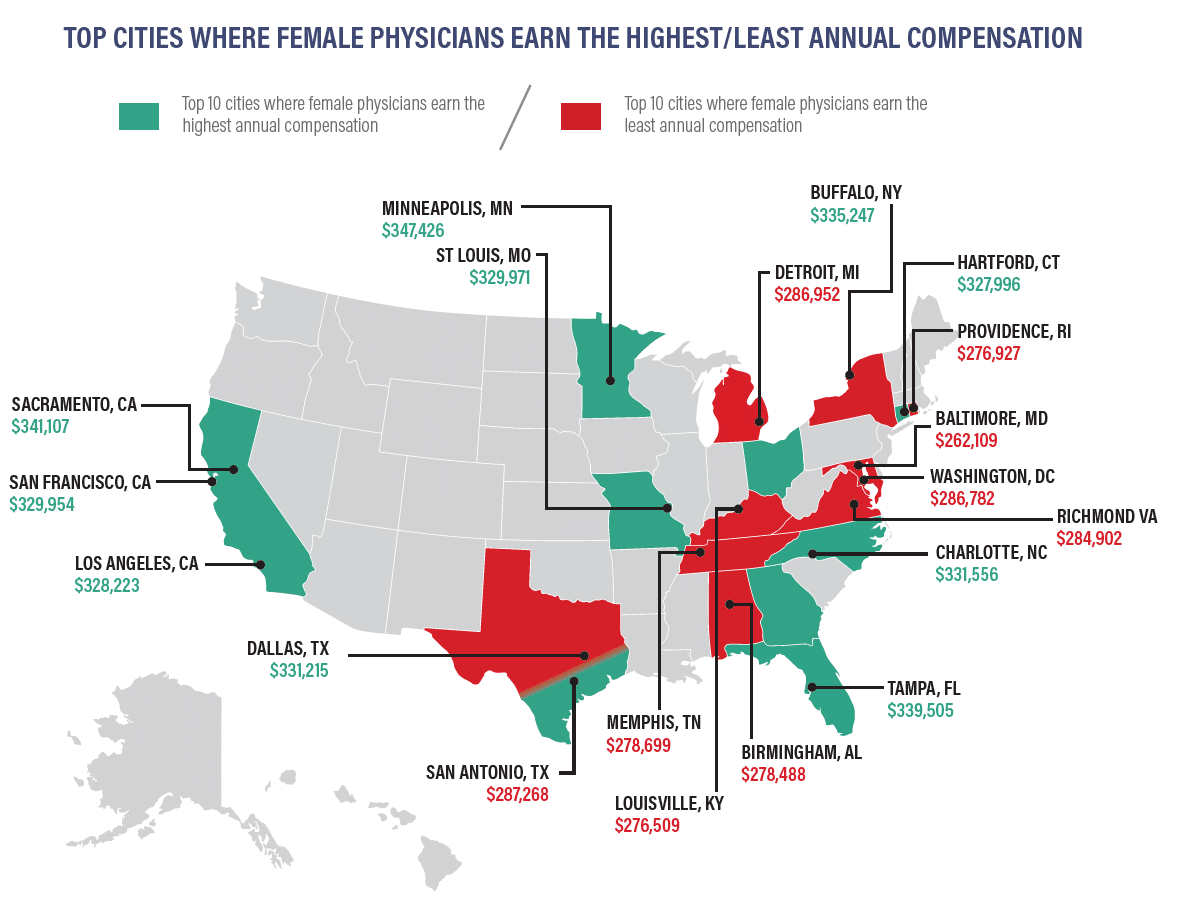
The pay gap between female and male physicians in the United States continued in 2022.
The overall gender pay gap between male and female physicians is significant. Current data shows that on average, male doctors earn $122,000 a year more than female counterparts. Analyzing the five medical specialties with the largest pay gaps between male and female practitioners, male specialists earned an average of $477,484 as compared to females in the same five specialties, who earned an average of $377,732, a difference of over 20%.
Pay does vary depending on location, so where do women earn the most and earn the least? Hartford, CT appeared on the lowest-paying list in 2021 and rose to the highest-paying in 2022.
Where is the gender wage the most prevalent?
Our findings illustrate that the gender pay gap varies considerably based on region and specialty.
Specialties with the largest gender wage gaps:
- Oral/Maxiollofacial Surgery: women earn 22.8% less
- Allergy & Immunology: women earn 21.1% less
- Otolaryngology: women earn 20.1% less
- Pediatric Nephrology: women earn 20% less
- Thoracic Surgery: women earn 19.5% less
Specialties with the largest gender wage gaps:
- Pediatric Rheumatology: women earn 7.8% less
- Pediatric Infectious Disease: women earn 10.1% less
- Pediatric Hematology/Oncology: women earn 11.3% less
- Hematology: women earn 12.1% less
- Pediatric Cardiology: women earn 12.5% less
Top 10 Cities Where Female Physician Earn the Highest Annual Compensation
- Minneapolis: $347,426
- Sacramento: $3414107
- Tampa: $339,505
- Buffalo: $335,247
- Charlotte: $331,556
- Dallas: $331,215
- San Francisco: $329,954
- St. Louis: $329,971
- Los Angeles: $328,223
- Hartford: $327,996
Bottom 9 cities Where Female Physicians Earn the Least Annual Compensation
- San Antonio: $287,268
- Detroit: $386,952
- Washington, DC: $286,782
- Richmond: $284,902
- Memphis: $278,699
- Brimingham: $278,488
- Providence: $276,927
- Louisville: $276,509
- Baltimore: $262,109
Related: How Female Physicians can Counteract the Gender Pay Gap
Compensation Bonuses
Physicians in both primary care and specialties continue to earn bonuses, and after a decline in 2021, RVU-based bonuses once again represent a major source of bonuses for physicians.
Bonuses for Quality of Care increased from 23% to 58% between 2021 and 2022.
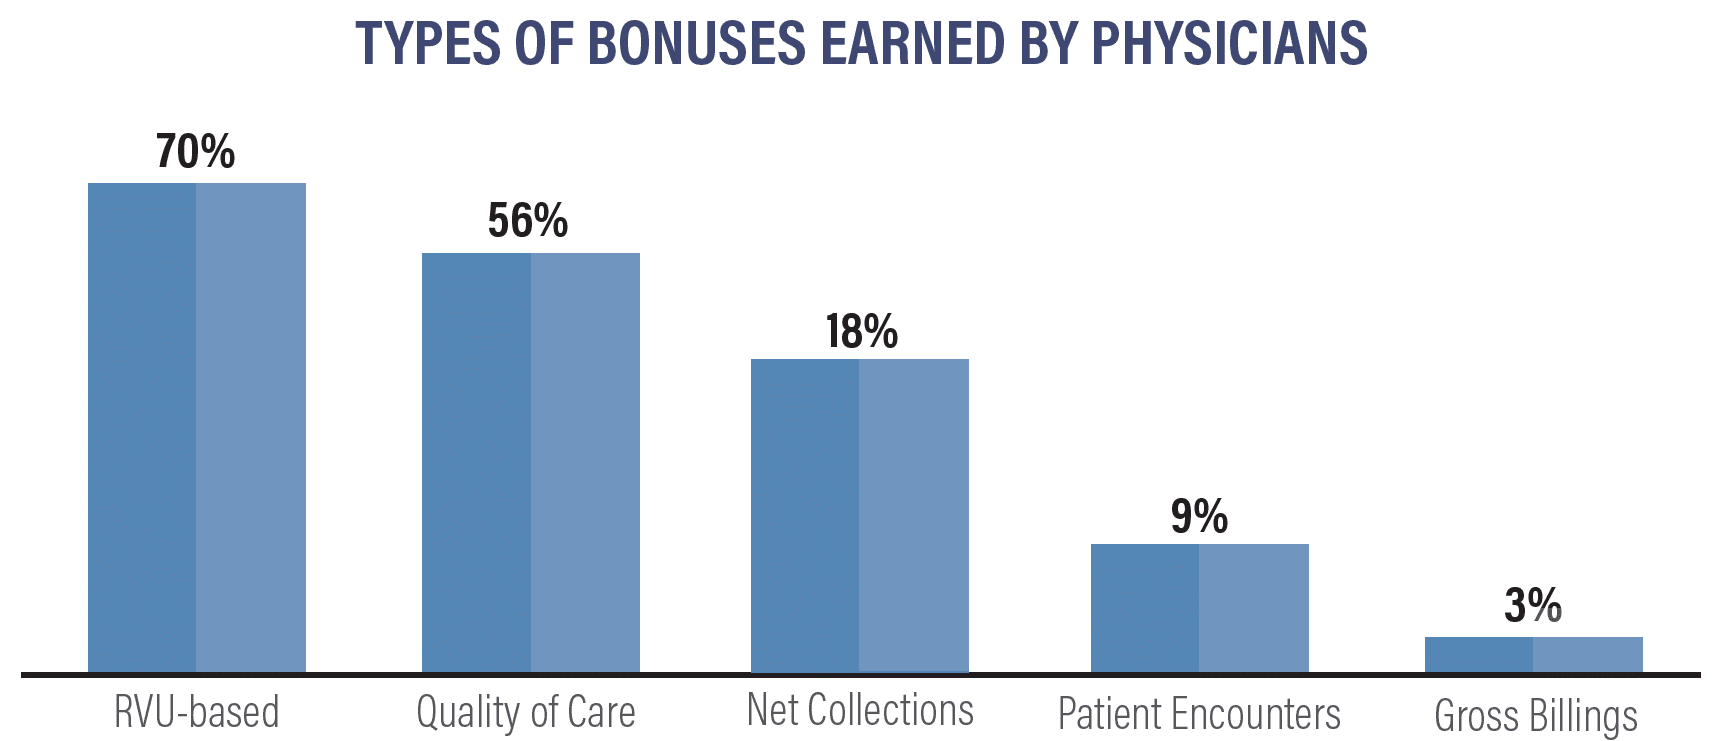
In 2022, here’s how bonuses compared to the previous year:
- RVU-based: 70% (up from 57% last year)
- Quality of Care: 26% (up from 23% last year)
- Net Collections: 18% (down from 23% last year)
- Patient encounters: 9% (down from 10% last year)
- Gross Billings: 3% (up from 2% last year)
Top 17 Average Incentive Bonuses by Specialty:
- Orthopedics/Orthopedic surgery: $126k
- Ophthalmology: $100k
- Cardiology: $85k
- Gastroenterology: $74k
- Urology: $73k
- Anesthesiology: $68k
- Radiology: $66k
- Pathology: $54k
- Emergency Medicine: $54k
- OB/GYN: $49k
- Physical Med/Rehab: $48k
- General Surgery: $46k
- Psychiatry: $33k
- Family Medicine: $30k
- Internal Medicine: $29k
- Neurology: $29k
- Pediatrics: $28k
For the first time in the past decade, every specialty reported receiving some form of incentive bonus. On an individual basis, 57% of specialists reported earning an incentive bonus in 2022. Amongst PCPs, 54% received an average incentive bonus of $33.5k.
Related: When Physicians Should Walk Away From a Job Offer
Compensation Trends Summary
Here are some key takeaways:
- Primary care physicians earned an average of $260,000 in 2022, up from $242,000 in 2021.
- Specialists earned an average of $368,000 in 2022, up from $344,000 in 2021.
- Depending on the specialty, physicians in the West and Midwest earn the highest salaries; however, for most specialties and PCPs, salaries in the East are the lowest.
- Plastic surgery and orthopedics #1 and #2 on annual compensation surverys, each earning over $500,000 per year, closely followed by cardiology, averaging $490,000 per year
- The biggest salary increases in 2022 were otolaryngology (up 13%), gastroenterology (up 12%), and dermatology (up 11%).
- Pediatrics is among the lower-paid specialties, but saw a 10% increase in pay on average in 2022. Ophthalmology and plastic surgery saw 10% salary increases as well.
- The biggest salary decreases are in cardiology and dermatology.
- On average, female physicians earn 23.6% less than male physicians in the same specialty.
- 57% of specialists earned an incentive bonus.
- 54% of PCPs earned an incentive bonus.
Hiring Trends
Hiring trends can change rapidly depending on regional and local needs. Rapid change in the healthcare system also creates demand for different specialties in different regions.
We use data from medical recruiting firms and annual surveys to create a breakdown of hiring trends based on specialty, region and medical setting.
Hiring Trends by Specialty
Between 2007 and 2019, family physicians were the most heavily recruited physicians around the country. In 2022, Nurse Practitioners became the most-requested hiring category. The COVID-19 pandemic and changing demographics are giving rise to the third consecutive year that specialists were the most-requested and recruited hiring category.
Top 10 Most Recruited Physicians:
- Gastroenterologists
- Radiologists
- Rheumatologists
- Hematologist/Oncologists
- Urologists
- Cardiologists
- Pulmonary/Critical Care
- Psychiatrists
- OB/GYNs
- Neurologists
There are five specialties which generate up to seven times their salary for average net annual hospital revenue: cardiology, orthopedic surgery, gastroenterology, family medicine, and OB/GYN.
Continued focus on mental health and post-pandemic stress saw psychiatrists remaining on the most in-demand list.
The physician shortage is ongoing and is expected to continue for the next decade.
Projected deficit of physicians through 2034:
- Primary Care: 17,800-48,000
- Medical Specialists: 16,8080
- Surgery: 13,900
- Other (including NPs): 26,400
- Hospitalists: 1,900
The physician shortage continues, along with shortages in specific specialties and allied practitioners.
By 2034, the overall shortage of physicians in the United States could reach 124,000. Of that, approximately 48,000 are primary care physicians and 76,000 will be specialists, ssurgeons, or hospitalists.
Hiring Trends by Region
The Eastern region and most large metro areas throughout the nation have the greatest number of trained physicians. Midwestern and Southern states, along with rural areas, are confronting large aging populations and have a greater shortage of trained practitioners. Hiring surveys show that areas with a shortage of physicians continue to offer higher salaries and larger bonuses to attract qualified candidates.
Shifts in care models are also affecting recruitment and hiring, including an increase in academic medical center recruitment and a move toward convenient care and telemedicine. Here’s how recruitment trends have changed, based on employment setting, over the past year:
- Hospital recruitment: 34% in 2022 (up from 33% in 2021)
- Medical group recruitment: 18% in 2022 (down from 29% in 2021)
- Academic medical center recruitment: 34% in 2022 (up from 20% in 2021)
- Federally qualified health center recruitment: 8% in 2022 (unchanged from 8% in 2021)
- Physician recruitment for solo, partnership, and concierge practices: 31% in 2022 (down from 3% in 2021)
Regardless of specialty, some employment settings offer higher salaries than others. Here’s how the average salary varies by employment setting for some of the top-earning specialties:
Orthopedic Surgery (General)
- Single specialty: $650k
- Multi-specialty: $663k
- Rural Health Clinic: $603k
- FHospital Department Practice: $675k
- Academic Department: $400k
Cardiology (Invasive-Interventional)
- Single specialty: $627k
- Multi-specialty: $601k
- Rural Health Clinic:$656k
- Hospital Department Practice: $626k
- Academic Department: $425k
Urology
- Single specialty: $525k
- Multi-specialty: $521k
- Rural Health Clinic:$475k
- Hospital Department Practice: $506k
- Academic Department: $400k
The biggest factors causing physician shortages:
- An aging population: the number of people 65 and older is expected to grow by 42% between now and 2034.
- Retirements: more than two out of five current physicians will be over age 65 between now and 2034.
- Burnout, stress, and COVID-19 effects are also expected to have an impact on physician shortages.
- Regional and geographic impacts are expected to continue in areas with more aging adults (Midwest and South).
- Telehealth and convenient care are influencing hiring trends and work conditions.
In 2021, some recruits did not receive relocation benefits that were standard before the pandemic, but some benefits were restored in 2022, along with decreases in most benefit packages.
In 2020/2021, 74% of new offers included relocation expenses, increasing to 78% in 2021/2022.
CME offers remained relatively stable, with 92% of new offers receiving CME payments this year, down from 94% last year.
Other benefits are down across the board for new hires:
- Health insurance: 68% (down from 78% last year)
- Malpractice: 66% (down from 78% last year)
- Retirement/401k: 61% (down from 68% last year)
- Disability: 61% (down from 70% last year)
- Educational Forgiveness: 16% (down from 21% last year)
Hiring Trends Summary
Here are the key takeaways:
- We are continuting to see a shortage of physicians, particularly in the Midwest and Southern regions. This is not expected to change.
- Demand for physicians is expected to increase, some specialties more than others.
- Underserved and Rural areas pay the highest salaries as well as the biggest bonuses.
- Family Physicians, which used to be in the highest demans, have not been the most recruited physicians since 2020.
Ongoing Impacts of COVID-19 and Other Trends
COVID-19 continues to impact the healthcare industry. Trends like telemedicine and “convenient care” affect work along with issues like burnout & stress.
Overall, salary trends for all physicians are up, including primary care physicians and specialists. However, among physicians who saw a decrease in income, 70% said that they continued to experience effects of the COVID-19 pandemic, including reductions in hours or job loss. 44% of physicians who lost income in 2022 credited another factor, including telehealth provided by insurance companies and convenient care at “minute clinics.”
Covid Effects in 2022:
As a result of COVID-19, in 2021, 72% of physicians reported a reduction in income, 43% had to work with reduced staff, and 8% closed their practices. By 2022, hiring had increased and long-term health challenges and the aging population drove rehiring and increased income:
- 15% experienced a reduction in income, down from 72% in 2021
- 8% have had to work with reduced staff
- 8% have had to close their practice; largely a result of retirement
The pandemic has taken a serious toll on physicians’ lives outside of work as well. Physicians report experiencing the following:
- Burnout: 58%
- Feelings of anger and/or anxiety: 50%
- Withdrawing from family and friends: 43%
- Sought medical attention for a mental health issue: 13%
Covid Continues to Affect Life Outside of Work:
Physicians report heavier workloads along with the following impacts:
- Burnout: 68%
- Feelings of anger and/or anxiety: 53%
- Withdrawing from family and friends: 35%
- Sought medical attention for a mental health issue: 17%
More than 38% of physicians surveyed have also expressed a desire to retire in the next year.
Would Physicians Choose the Same Specialty Again?
If given the chance to change careers, 73% of physicians said they would choose to work in medicine again. Of those, the majority of specialists are satisfied with their choice of specialty, although some are more satisfied than others.
Physicians Most Likely to Choose the Same Specialty Again:
- Dermatology: 99%
- Orthopedics: 97%
- Plastic Surgery: 96%
- Gastroenterology: 95%
- Infectious Disease: 94%
- Ophthalmology: 94%
- Radiology: 92%
- Urology: 90%
Physicians Least Likely to Choose the Same Specialty Again
- Pulmonary Medicine: 79%
- Public Health/Preventative Medicine: 79%
- OB/GYN: 76%
- Emergency Medicine: 74%
- Nephrology: 73%
- Family Medicine: 68%
- Internal Medicine: 63%
How Many Hours Are Physicians Working?
Physicians are working approximately the same number of hours now as they were prior to COVID-19, an average of 50 hours per week. Slightly more than 20% of physicians work 40 to 49 hours a week, about 25% work between 50 and 59 hours a week, and over 30% work more than 60 hours a week.
Time Spent on Patient Care versus Paperwork:
Physicians are spending an average of 15.48 hours per week on paperwork and administration. Different specialties are required to spend more time on paperwork than others.
Infectious disease specialists spend 19.8 hours a week on paperwork and administration, while anesthesiologists spend 10 hours a week.
Specialties like endocrinology, rheumatology, and OB/GYN average 15 hours per week on paperwork.
Are Physicians Happy?
Many physicians feel that their work is rewarding and their salary is fair. But how happy are physicians on the job?
Data shows that significant numbers of physicians don’t feel as though they are being fairly compensated and that they are dissatisfied with a variety of work conditions. However, the rewards of helping patients and discovering answers continue to provide happiness and satisfaction.
Aspects of the job that physicians find the most rewarding:
- Gratitude/relationships with patients: 27%
- Finding answers/making diagnoses: 25%
- Helping others: 23%
- Earning the salary: 12%
- Making good money at a job I like: 10%
- Being proud to be a physician: 5%
- Teaching: 5%
- Nothing: 3%
- Other: 2%
Aspects of the job that physicians like the least:
- Having so many rules and regulations: 23%
- Working long hours: 15%
- Difficult patients: 15%
- Difficulty getting reimbursement: 12%
- Working on an EHR system: 12%
- Other: 10%
- Worrying about being sued: 7%
- Danger/risk of treating COVID-19 patients: 3%
- Nothing: 3%
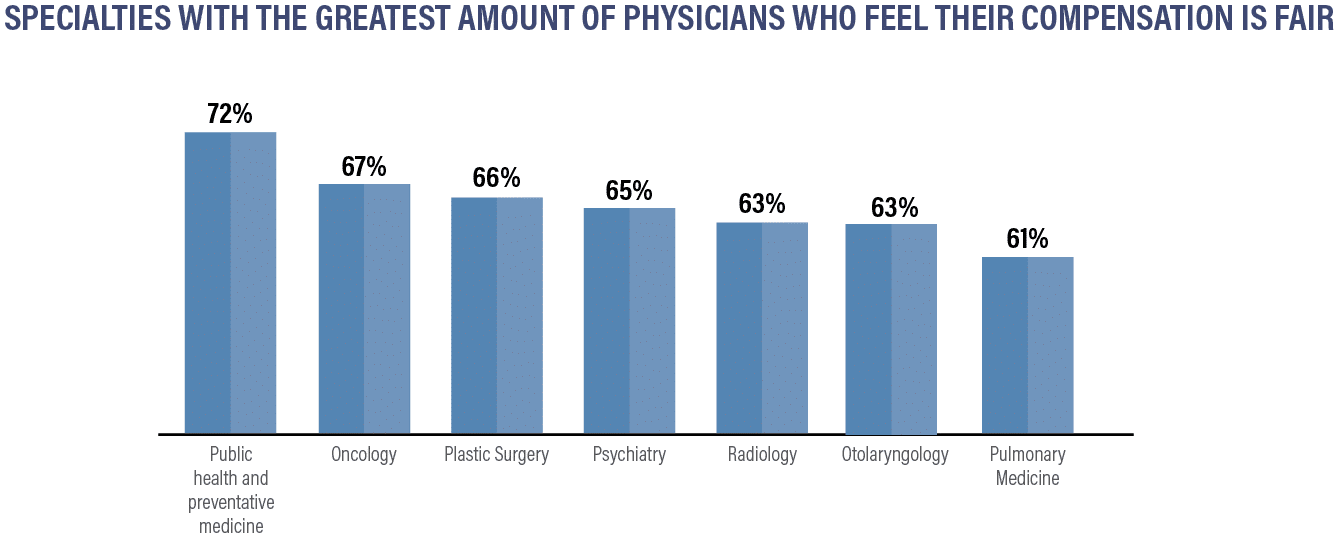
Specialties with the Greatest Amount of Physicians Who Feel Their Compensation is Fair:
- Public Health & Preventative Medicine: 72%
- Oncology: 67%
- Plastic Surgery: 66%
- Psychiatry: 65%
- Radiology: 63%
- Otolaryngology: 63%
- Pulmonary Medicine: 61%
Specialties Who Do NOT Believe They are Fairly Compensated:
- OB/GYN: 49%
- Internal Medicine: 49%
- Physical Med & Rehab: 49%
- Pediatrics: 47%
- Diabetes & Endocrinology: 46%
- Nephrology: 42%
Many physicians are satisfied with their work and compensation, but medicine is challenging and a number of physicians are experiencing burnout and stress.
Physicians continue to work long hours, and industry change is ongoing. Many physicians are asked to work with difficult-to-use and time-consuming EHR systems and cope with staff shortages. Physicians can discover their options and work with professionals to obtain the compensation they want and sign contracts that can improve their job satisfaction.
About to sign a physician contract for the first time? Conducting a job search in a new state? Wondering how your incentives and bonuses stack up against other physicians in your specialty or others?
This report shows the current landscape of compensation and hiring trends to help physicians gather industry data and analyze their potential, no matter where they are in their careers.
Figures provided are averages and can change. To understand your market value for your specialty and region, talk with one of our expert contract review specialists. We can help you negotiate the compensation you deserve.
To hire a contract review specialist, discuss financial planning for retirement, find creative tax-saving solutions, or protect your finances with disability insurance or life insurance, contact Physicians Thrive now.
SOURCES FOR THIS REPORT INCLUDE:
- Bureau of Labor Statistics Occupational Outlook Handbook
- Doximity 2021 Physician Compensation Report
- Salary.com
- Merrit Hawkins 2022 Review of Physician and Advanced Practitioner Recruiting Incentives
- Medscape 2022 Compensation Overview
- The Complexities of Physician Supply and Demand: Projections from 2019 to 2034 (AAMC)
- HRSA: Health Workforce Shortage Areas
- Changes in Buronout and Satisfaction with Work-Life Integration in Physicians During the First Covid-19 Pandemic
Interested in our 2022 Compensation Report? Keep Scrolling!
THE 2022 PHYSICIAN COMPENSATION REPORT
Regardless of your specialty or what city you work in, most physicians are curious about how their salary stacks up against the competition.
Whether you’re thinking about practicing in a new state or wondering if your signing bonus is on par with what it should be, know the facts to protect yourself and your annual earnings.
Let’s answer some questions about:
- Which physicians make the most money?
- Moving a few states away to increase your salary?
- How your specialty compares against the salaries of physicians in other areas of medicine?
- How much physicians are really making
- Which specialties are in the greatest demand
- Which regions of the country are hiring the most
- Where physicians are being offered the biggest bonuses
Spending hours pouring through hundreds of pages in pricey compensation reports is usually the only way to find this information — but we did the legwork for you.
We have created our annual physician compensation report to save you both time and money looking for the data and statistics you want to know.
In this report, we detail:
- How physicians in different medical specialties and regions of the United States are being compensated for their work
- The gender wage gap
- How much physicians are earning in bonuses and incentives
- Which specialties are in the greatest demand
We’ve compiled data from nearly a dozen different sources from data made available as of 2021 to offer you:
Compensation by Region
Large and mid-sized metro areas, where there are more medical institutions and more medical professionals, continue to pay some of the lowest salaries.
Rural areas, which tend to have a more difficult time recruiting top-tier talent, continue to pay some of the highest salaries in the country.
There are, however, some mid-sized metro areas that saw a salary increase. Five of the ten are located in the Southeast region of the U.S.
Metro areas with the biggest salary increases:
- Providence +8.9%
- Portland, OR +8.6%
- Richmond, VA +7.5%
- Las Vegas +7.2%
- New Orleans +7.2%
- Birmingham +6.9%
- Atlanta +6.8%
- Denver +6.7%
- Salt Lake City +6.5%
- Jacksonville +6.3%
Metro areas that pay the highest salaries:
- Milwaukee: $430,274
- Atlanta: $428,244
- Jacksonville: $427,090
- Buffalo: $407,070
- Orlando: $406,587
- Raleigh: $406,365
- Charlotte: $404,285
- Minneapolis: $401,978
- Riverside, CA: $397,005
- Dallas: $396,184
Metro areas that pay the lowest salaries:
- San Antonio: $329,475
- Virginia Beach: $331,952
- Boston: $347,894
- Baltimore: $348,389
- Washington D.C: $351,272
- Denver: $352,073
- Philadelphia: $354,788
- Memphis: $356,875
- Louisville: $360,609
- Providence: $365,807
In addition to having more medical professionals overall, the metro areas paying the smallest salaries have a few other things in common.
Many of them have older healthcare infrastructures as well as plateauing populations. This is especially the case with cities on the eastern seaboard, such as D.C., Baltimore, Philadelphia, and Boston, as large groups of people are moving out of these more expensive cities in favor of more affordable cities in the South and Midwest.
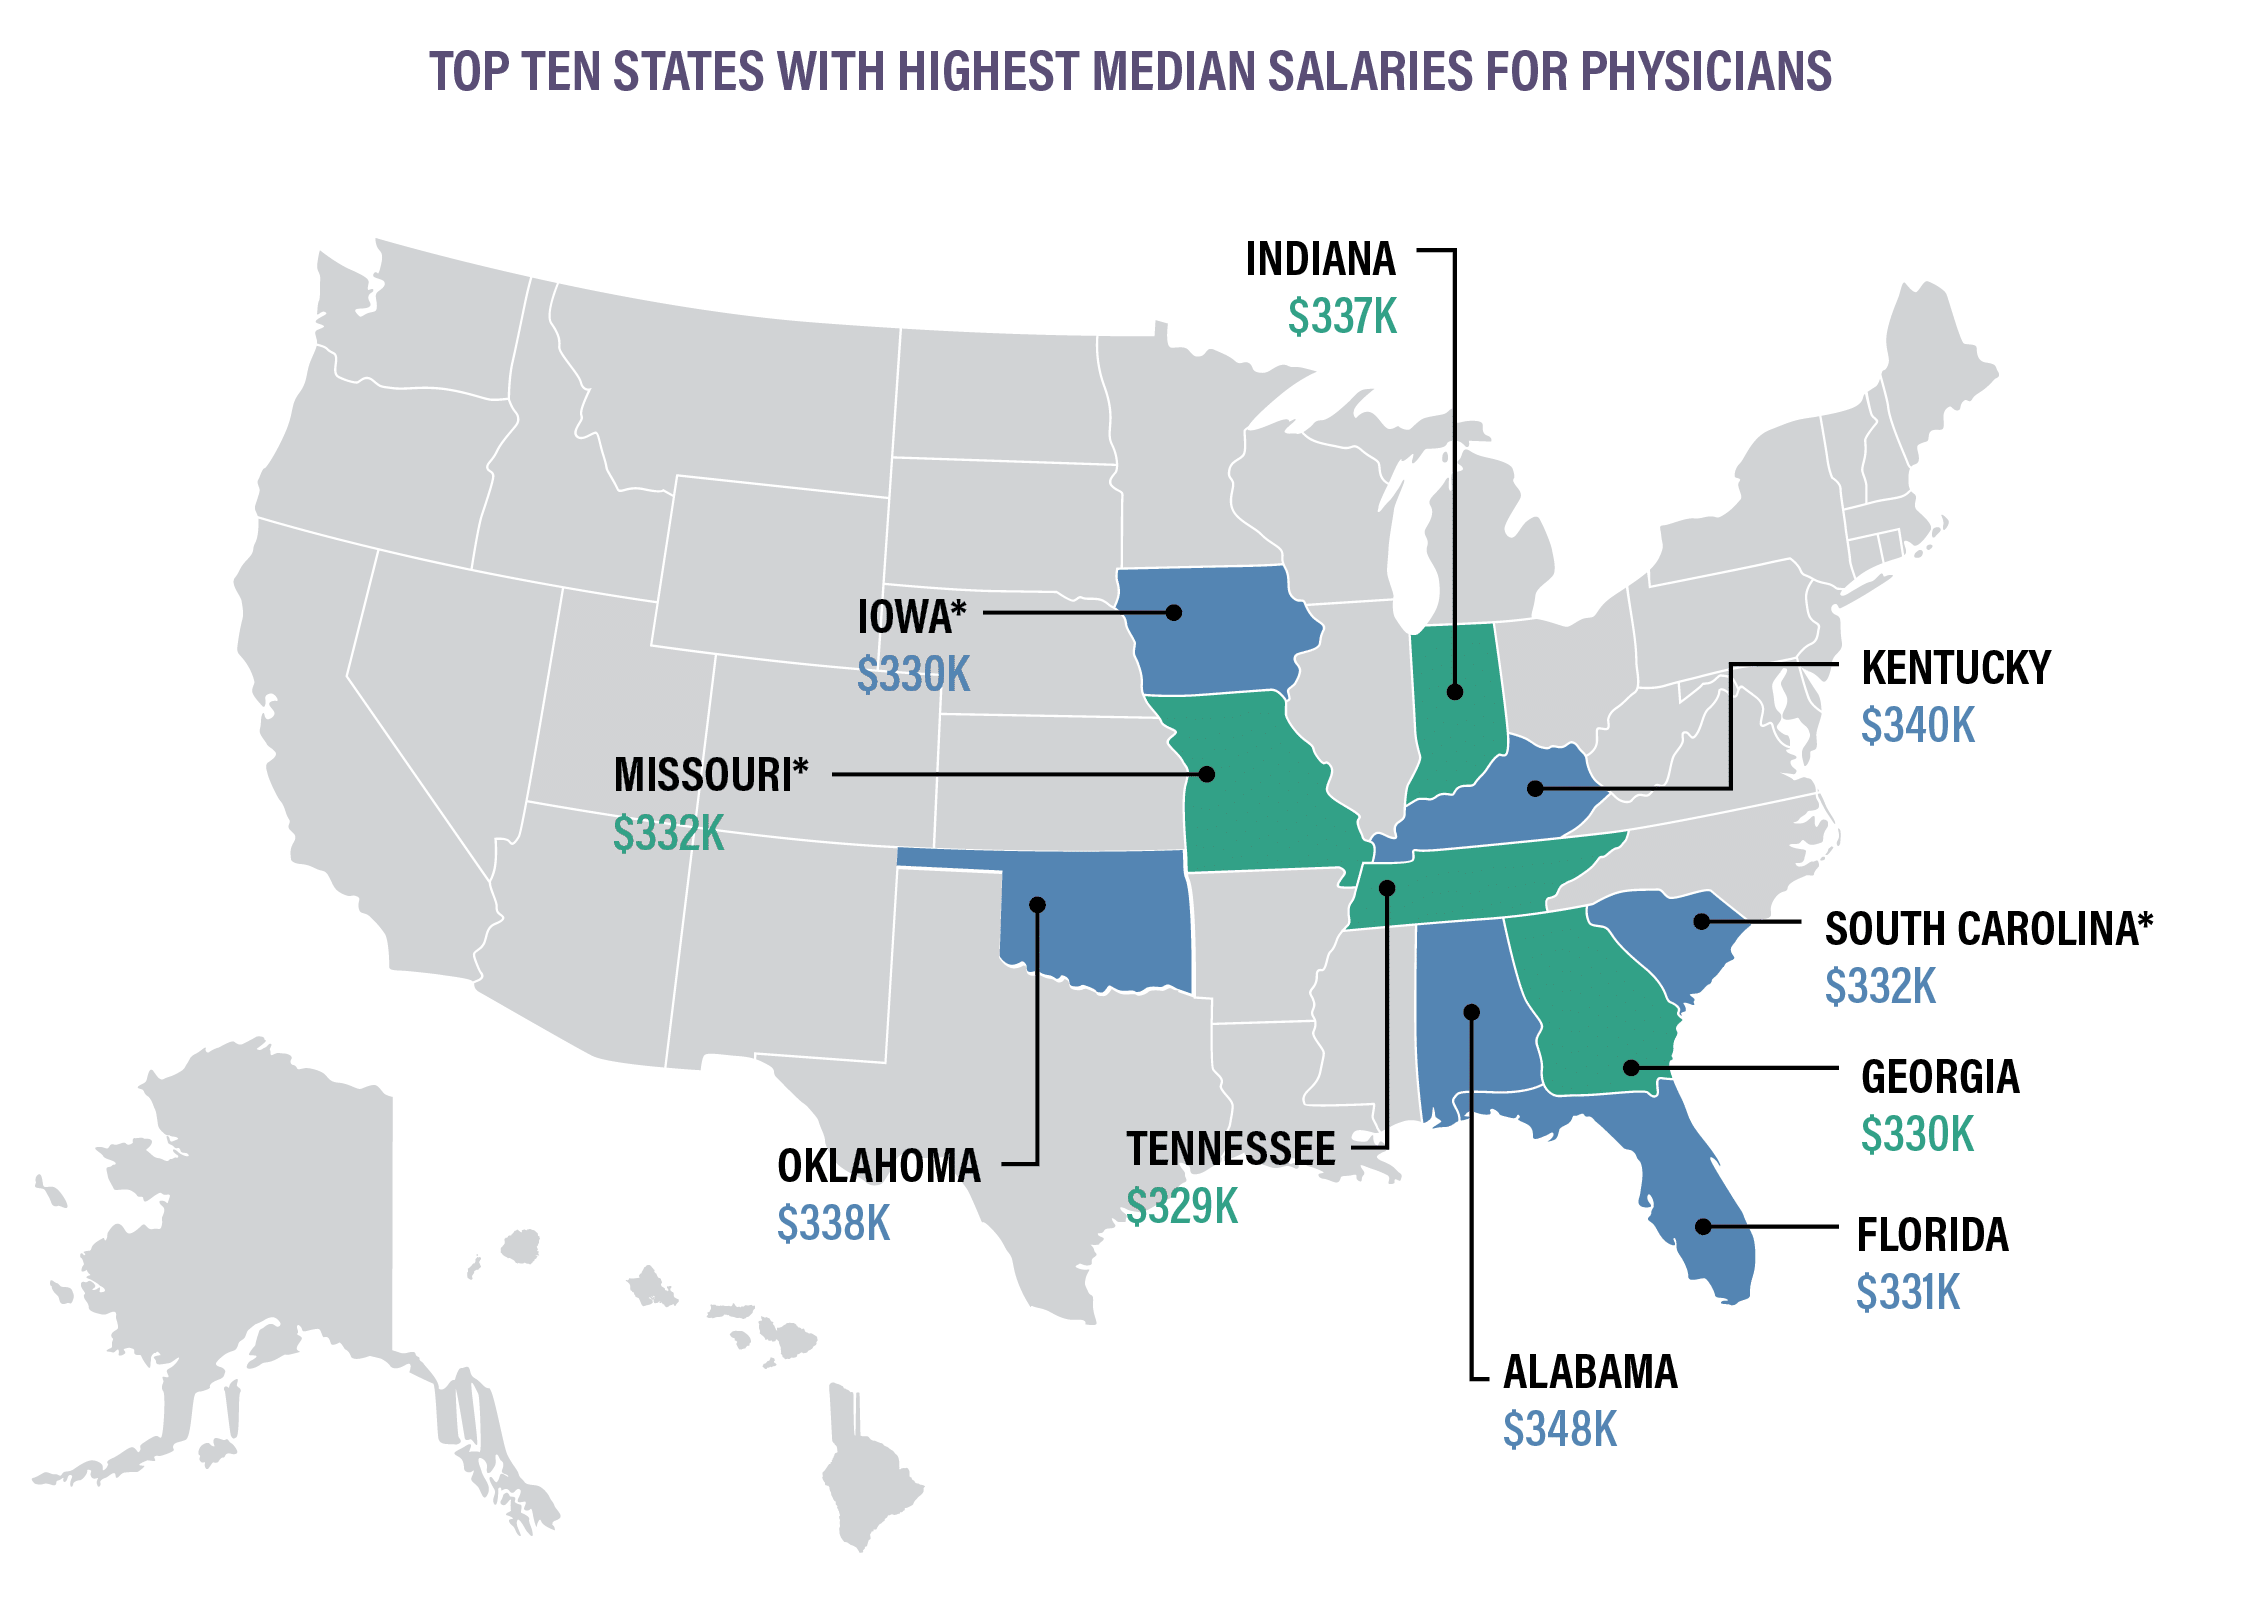
*Indicates states that are new to the top ten for 2020. These states replaced Utah, Ohio, and North Carolina.
Physicians in rural areas are earning higher salaries than those in metropolitan areas. Data shows that physicians across the highest-paying specialties are earning more in rural regions:
Overall, the Midwest and the South make the most, while physicians on the East and West coasts earn the least. There are a variety of reasons for this variation in pay, with the higher concentration of qualified physicians in the Northeast region continuing to be one of the most significant.
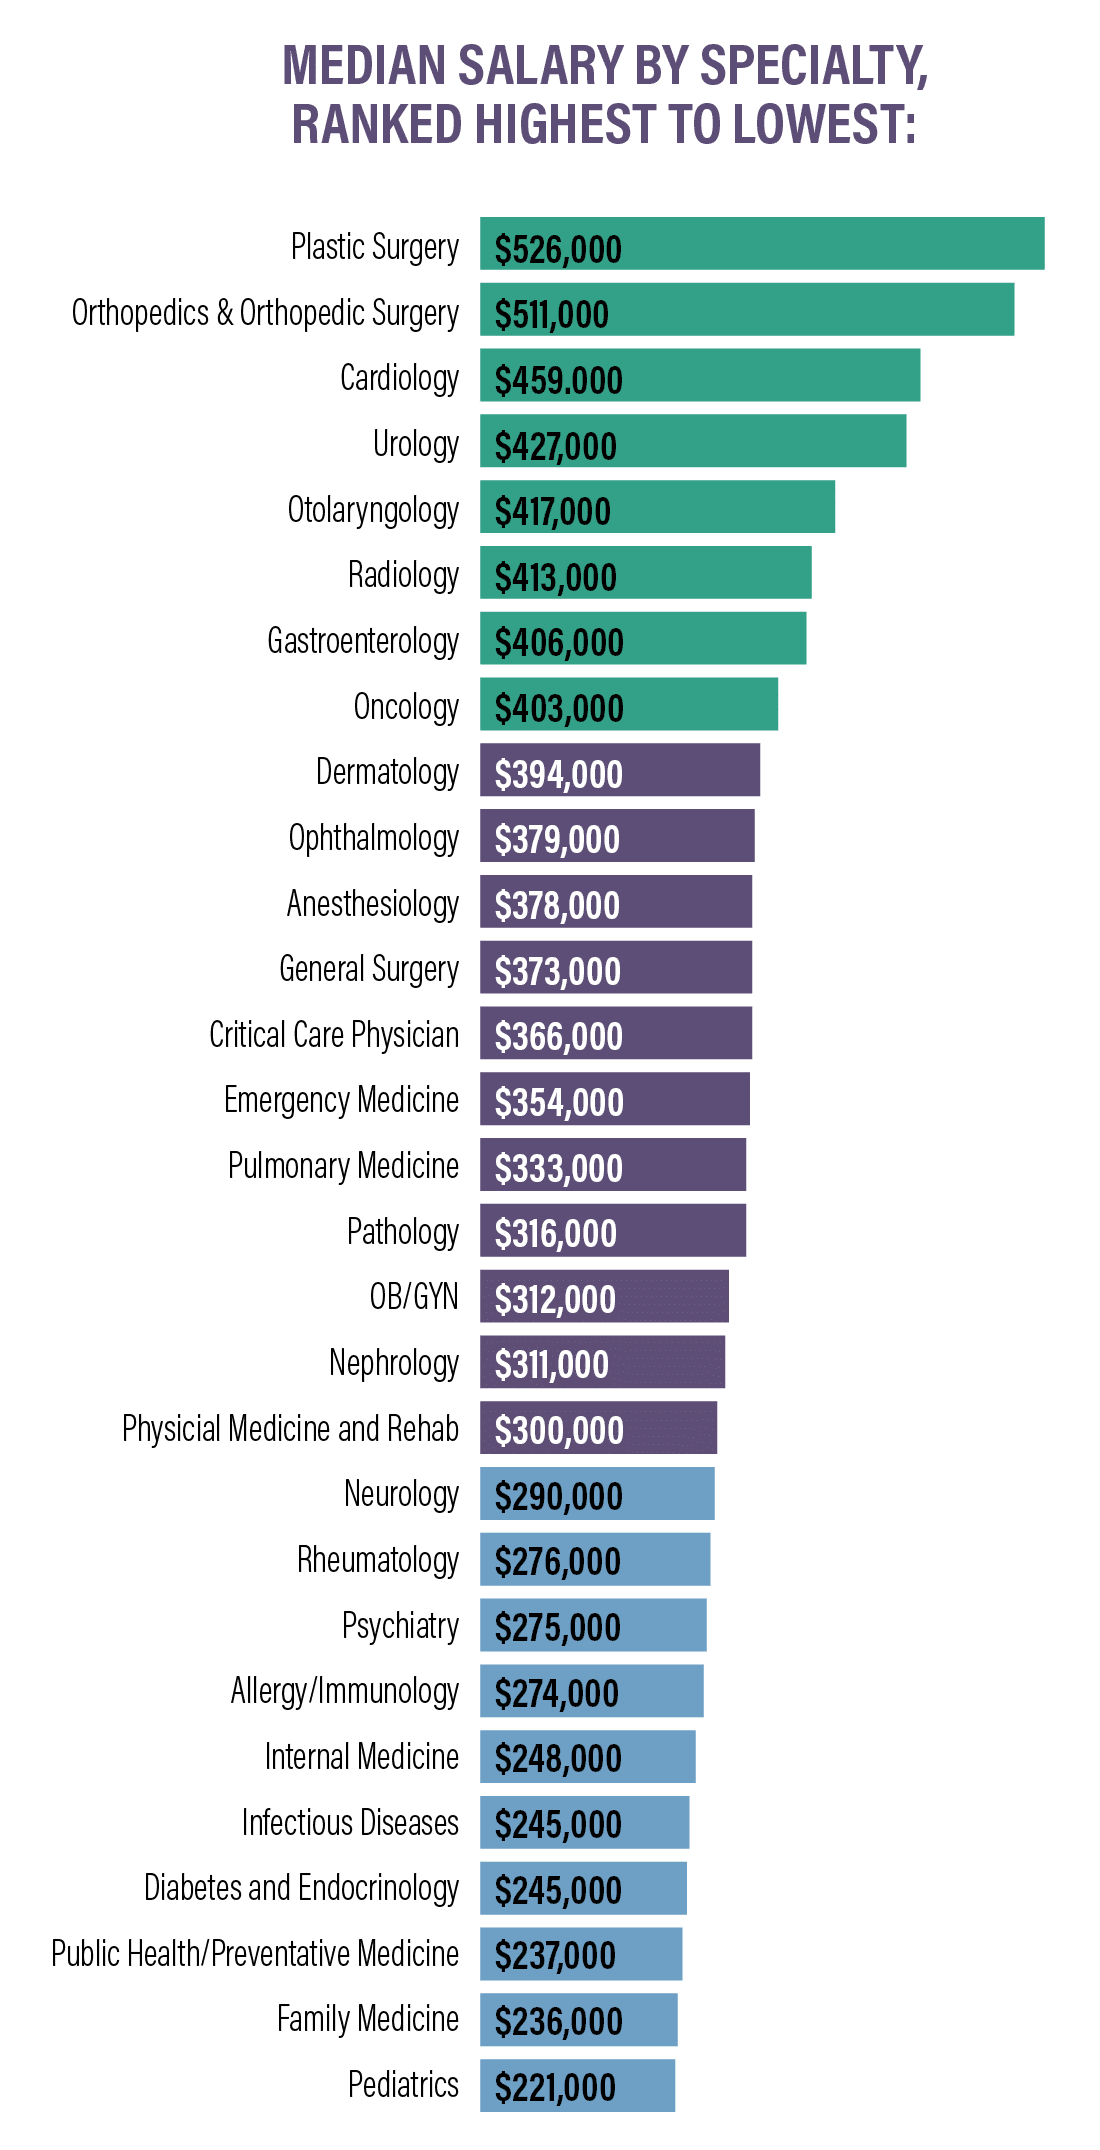
PCPs earned an average of $242k in 2021, down slightly from $243k in 2020. Specialists earned an average of $344k in 2021, down from $346k in 2020.Surgical specialists continue to be among some of the highest-paid professionals in medicine. Pediatricians and those who practice family medicine continue to be among the lowest-paid physicians.
Specialties with the biggest salary increases:
- Plastic Surgery +10%
- Oncology +7%
- Rheumatology +5%
- Cardiology +5%
- Diabetes and Endocrinology +4%
Specialties with the biggest salary decreases:
- Allergy/Immunology -9%
- Otolaryngology -9%
- Anesthesiology -5%
- Pediatrics -5%
- Dermatology -4%
Plastic surgeons and orthopedic surgeons are the highest earners and are the only specialties with an average compensation of over $500,000.
Compensation by Gender
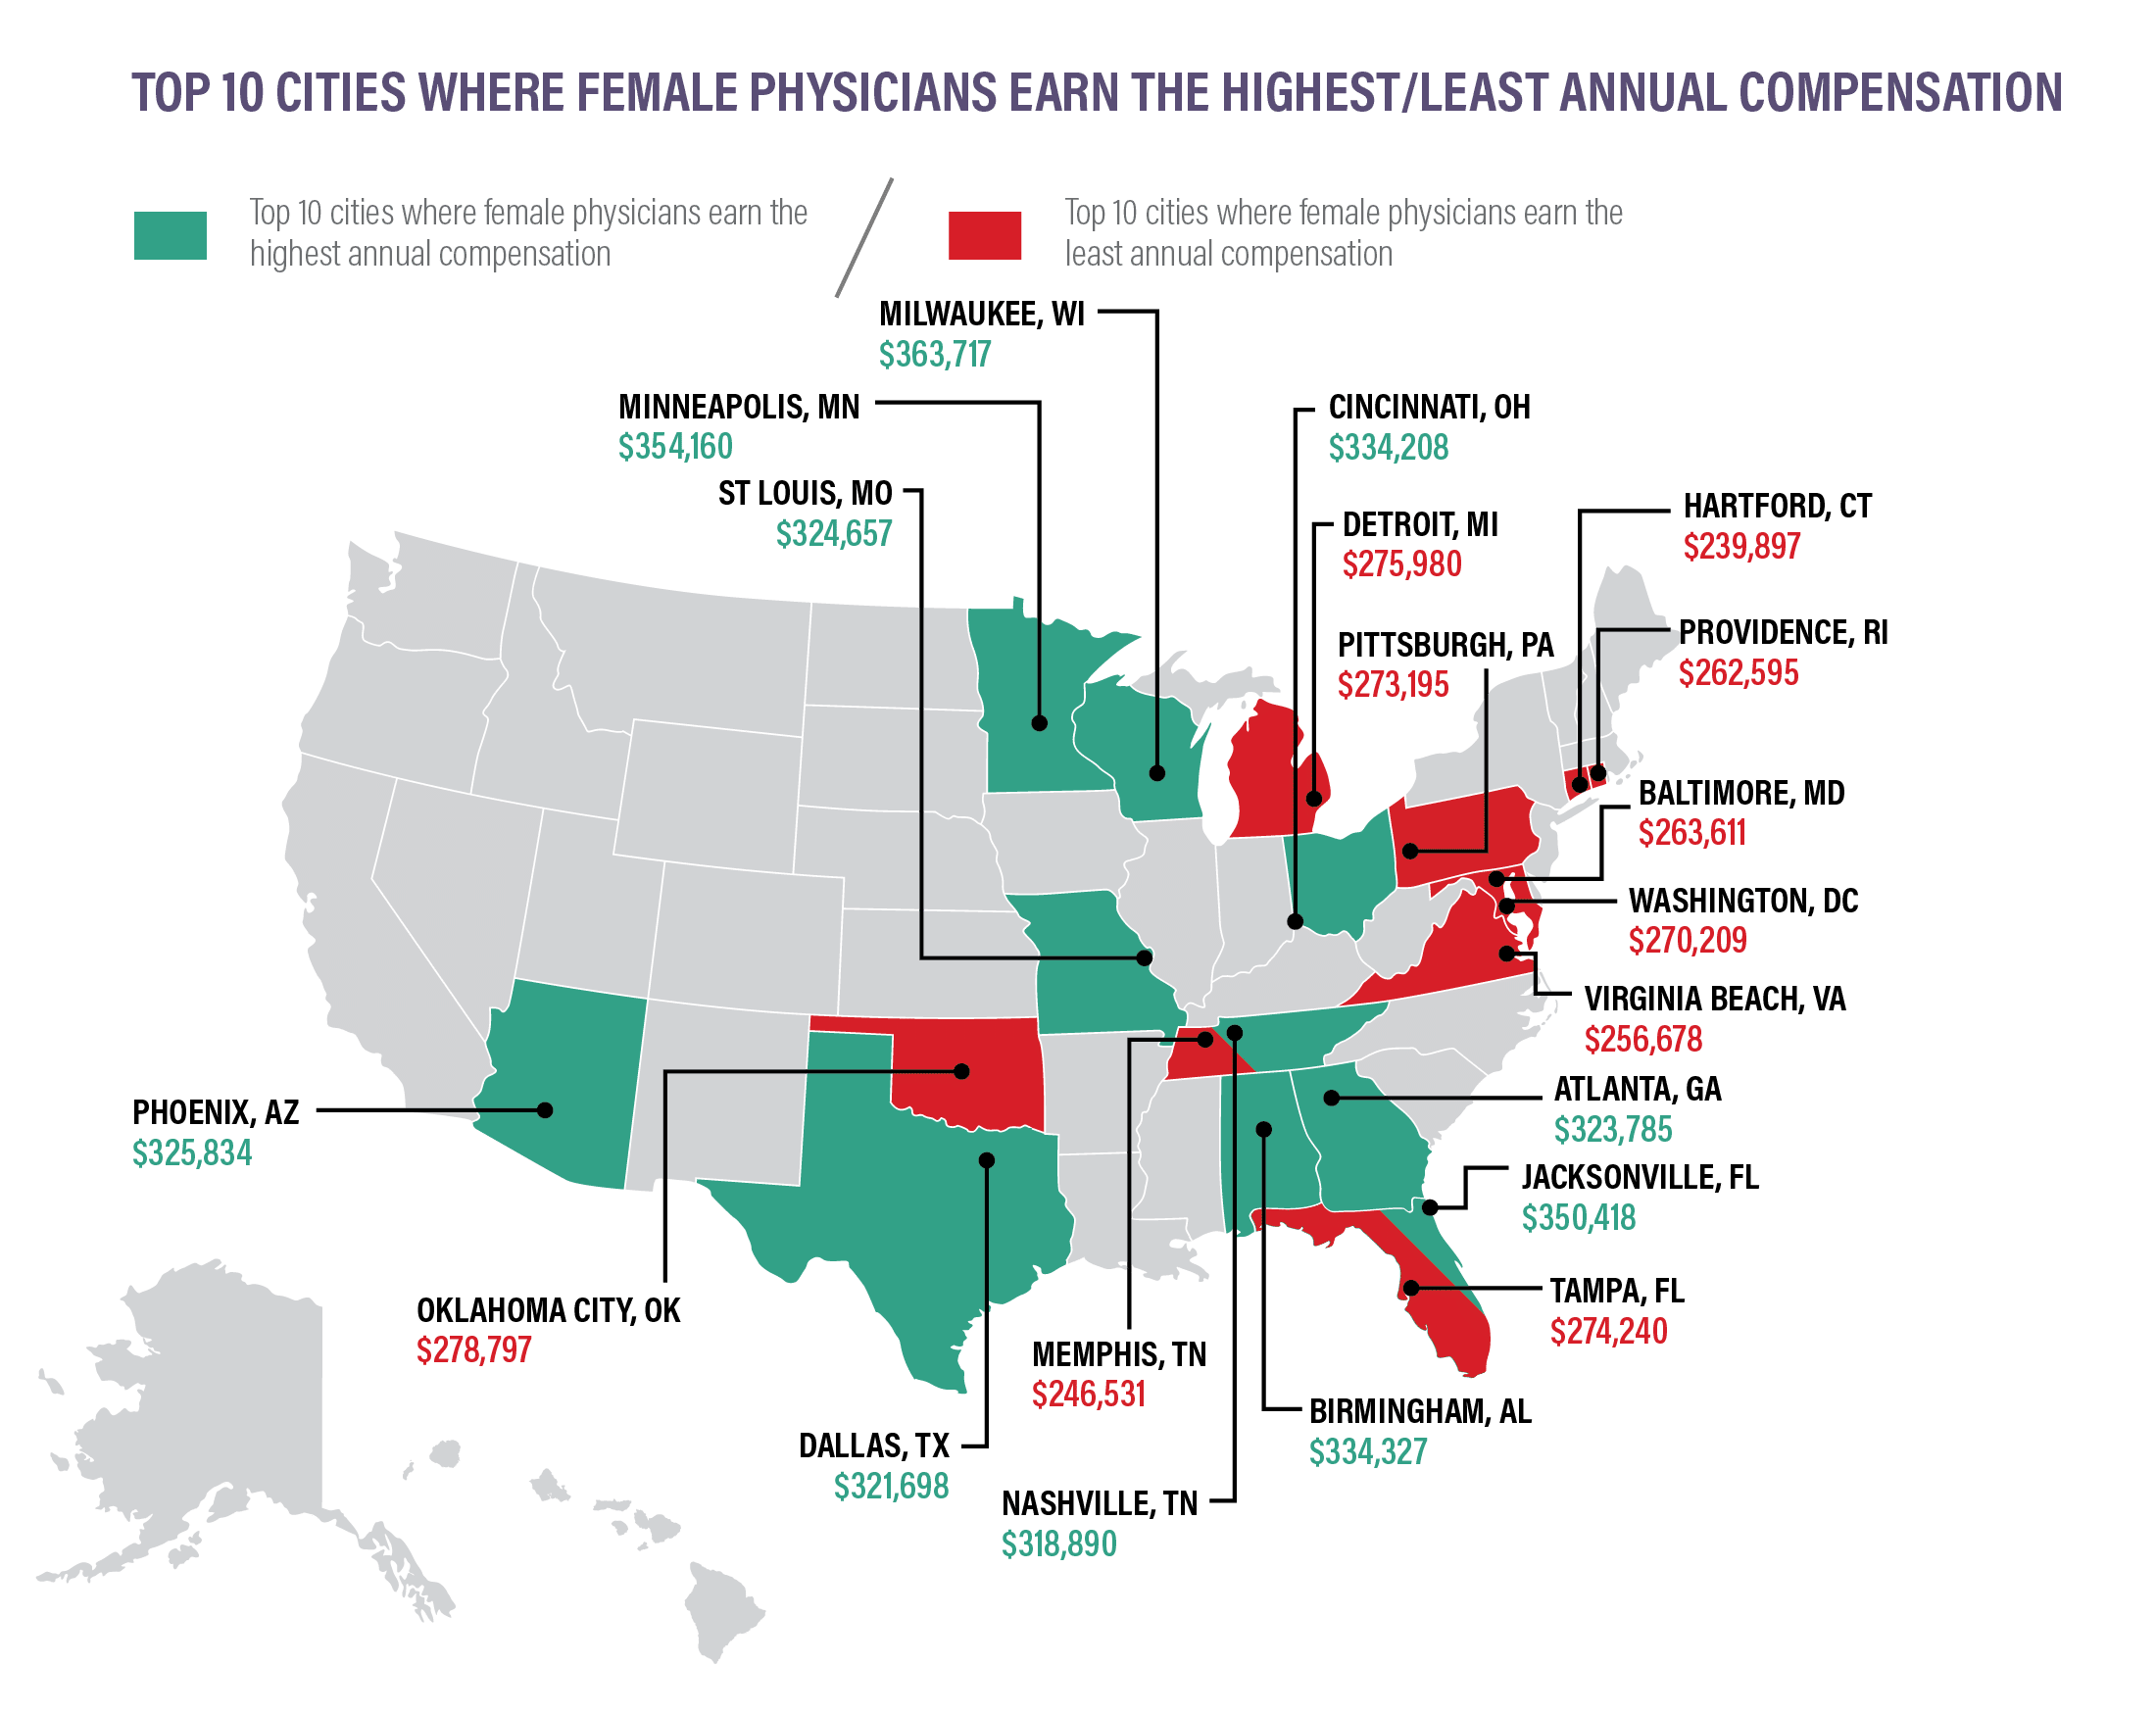
As in most professions, there continues to be a pay gap based solely on gender in the U.S.
Data shows that in primary care, men earn $269k per year, while women earn just $211k, approximately 22% less than their male counterparts. The gap is slightly larger in specialty medicine, with male specialists earning $376k per year and women specialists earning $283k (a difference of approximately 25%).
So, where do women earn the most and earn the least? Where is the gender wage gap most prevalent?
Our findings show that the gender pay gap varies considerably based on region and specialty.
Specialties with the largest gender wage gaps:
- Otolaryngology: women earn 22% less
- Geriatrics: women earn 21.4% less
- Orthopedic surgery: women earn 20% less
- Research: women earn 19.8% less
- OBGYN: women earn 19.6% less
Specialties with the smallest gender wage gaps:
- Nuclear medicine: women earn 2.5% less
- Hematology: women earn 11.4% less
- Urology: women earn 12% less
- Colon/Rectal surgery: women earn 12.2% less
- Emergency medicine: women earn 12.6% less
Compensation
Definitions and FAQs
Most physicians are not provided accurate or current compensation data that is useful for evaluating what is fair. Today’s databases lean toward employers by showing numbers that are in their best interests. Check out the information below to get up-to-date intelligence so that you are equipped for financial conversations.


Definitions
Compensation
WRVU
WRVU refers to work relative value units. For every patient examination or procedure you perform, you’ll receive a certain amount of work RVUs.
Those wRVUs are then multiplied by a conversion factor, which is a specific dollar amount. Every CPT code used for Medicare and Medicaid billing has a coordinating wRVU. They are pre-determined based on the complexity of the procedure or patient visit.
The more wRVUS you have, the more money you’ll earn.
Conversion Factor
The conversion factor is standard dollar amount. There is no flexibility to pay less or more to one doctor over another (at least not in terms of straight wRVU compensation).
The total RVU then gets multiplied by the Medicare conversion factor. The current conversion factor for 2020 is $36.0896. This is standard, regardless of the CPT code.
Relocation reimbursement
Relocation reimbursement or allowances are offered to many physicians, especially those who recently left training and do not yet have the means to cover the cost of taking a job in a different city or state.
A relocation bonus should cover:
- The cost of a moving company
- The cost for a visit before you move to find lodging in your new location
- The cost of transportation to your new location
- Temporary housing if needed
Signing bonuses
As a physician, when you are hired by a hospital or healthcare system, there may be a bonus attached.
In some cases, you may get your bonus in one lump sum when you receive your first paycheck.
However, your bonus might take a bit longer to receive. It may be tied to a specific point in time, and that’s because the hospital wants to make sure you stick around.
Productivity Bonus
Many physicians have the opportunity to earn a bonus based on their work RVUs or total RVUs.
Quality incentive bonus
Another common way physicians can bonus is with a quality incentive program. These programs are unique to every hospital, but often promote reducing readmission rates, improving patient satisfaction scores, and improving medical record documentation. These plans can be particularly useful in situations where the physician cannot control patient volume.
Ready for Review?
Request a compensation review to learn how your salary compares to other physicians in your field + talk with an advisor about how to start earning more.


