
What should I do with my investments right now?
Over the past 12 market days, the S&P 500 has dropped 17.5%. There is a global health crisis. Oil prices have dropped 45% YTD, 30% in just one day. Interest rates have plummeted.
Given the above, it’s natural for people to be concerned (even frightened) about what is going on, and wondering what they should do with their money?
Our investment team will go into more detail, but here are just a few quick bullet points for those who prefer the facts fast:
- Volatility isn’t new; it just always feels that way when it’s been a while since we’ve felt it. In this case, we’ve seen worse days, weeks, months, and starts to a calendar year. This market drop is bad, but far from the worst.
- Historically, episodes of panic-driven selling of equities would have caused investors to miss out on the market’s strongest days, lessening returns over the long term.
- Stocks are down, bonds are up. It’s important for all investors to have a mix of investments that is appropriate for their risk tolerance and financial needs. For many, that includes bonds (in some cases more bonds than stocks). The Aggregate Bond Index is up 5.71% through 3/6/2020.
Time to sell or time to stay put?
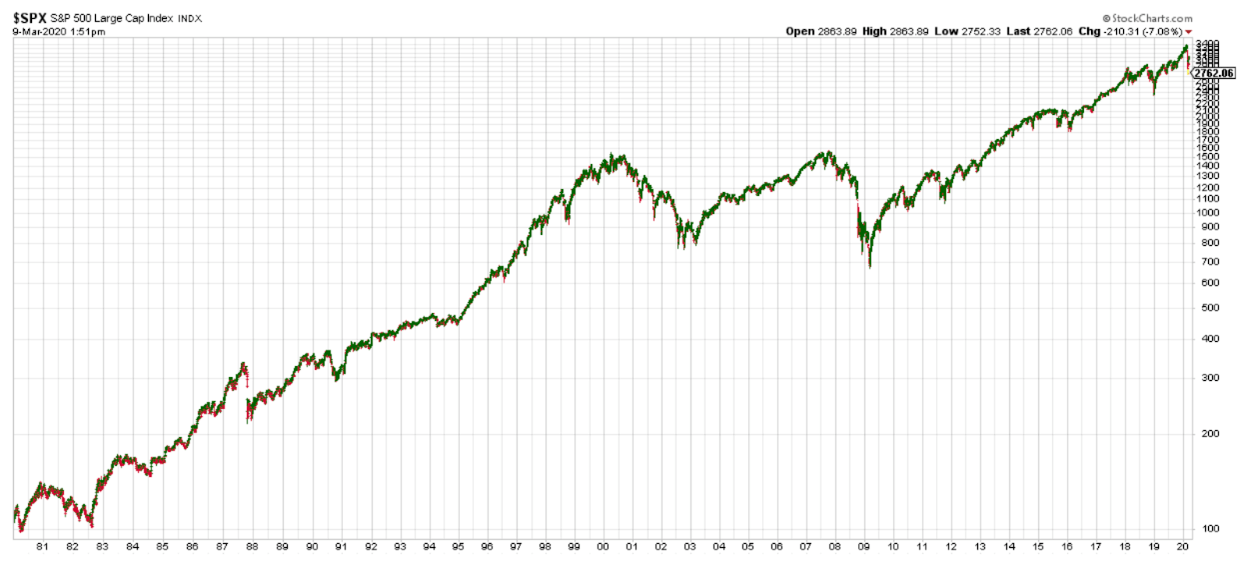
For some context, let’s look at a few charts. First, here’s the S&P 500 going back to 1980. With enough time horizon, it looks pretty good. You can certainly see multiple significant declines, but in all cases, the market recovered and rose to new highs.
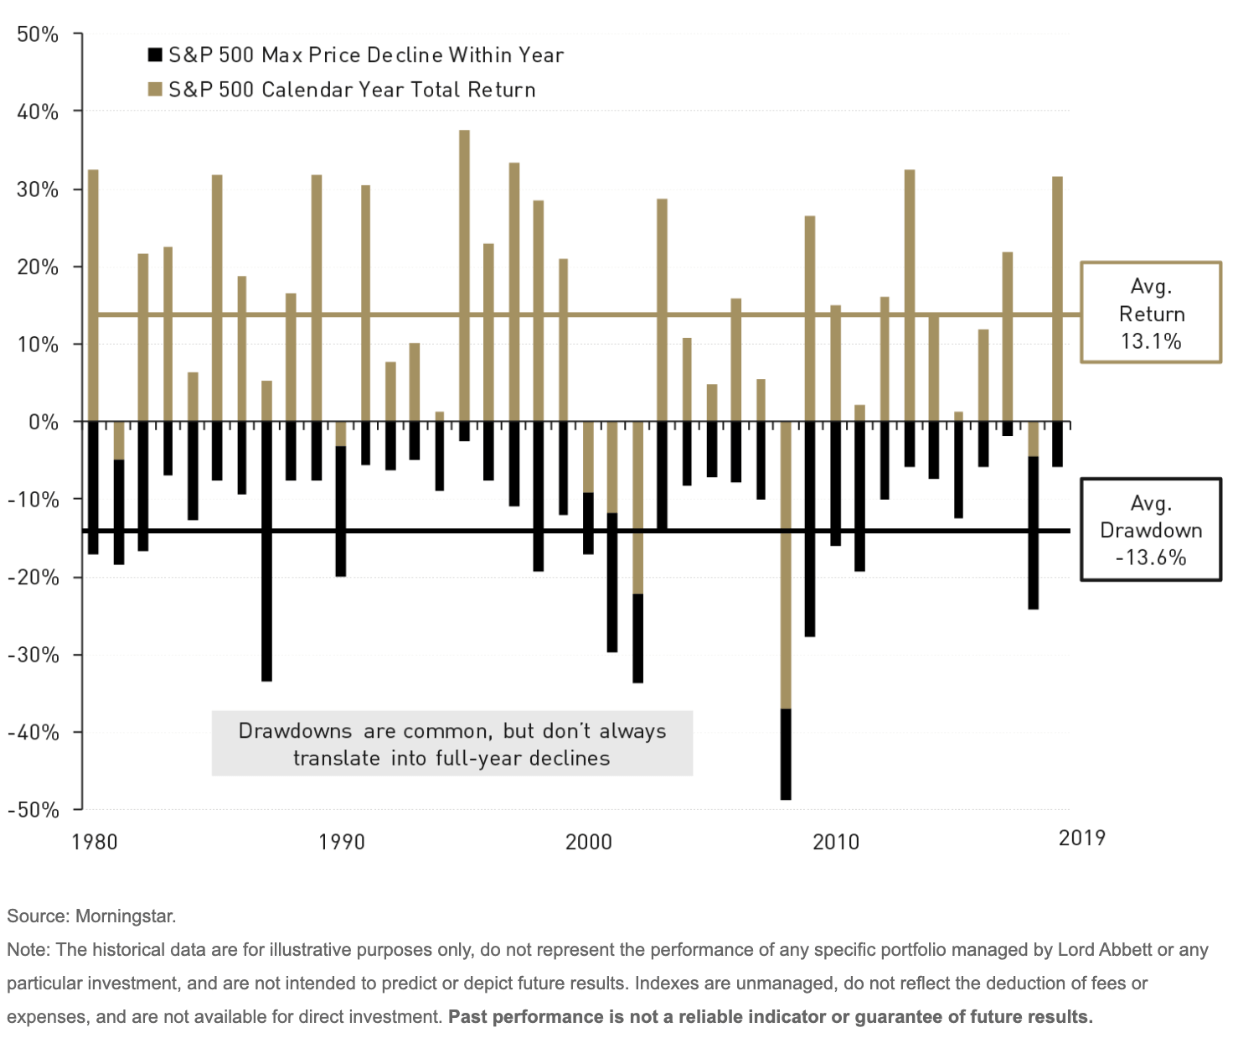
This next chart shows calendar year returns from 2019 with the gold bars representing the annual return and the black bars representing the maximum drawdown within that same year. The chart also shows the average intra-year drawdown and the average total return. This chart is useful because it helps illustrate that drawdowns are normal, that on average we should expect a drawdown of over 13% each year. As I write this (3/9/2020), the S&P 500 is down 17.6% from its highs in February.
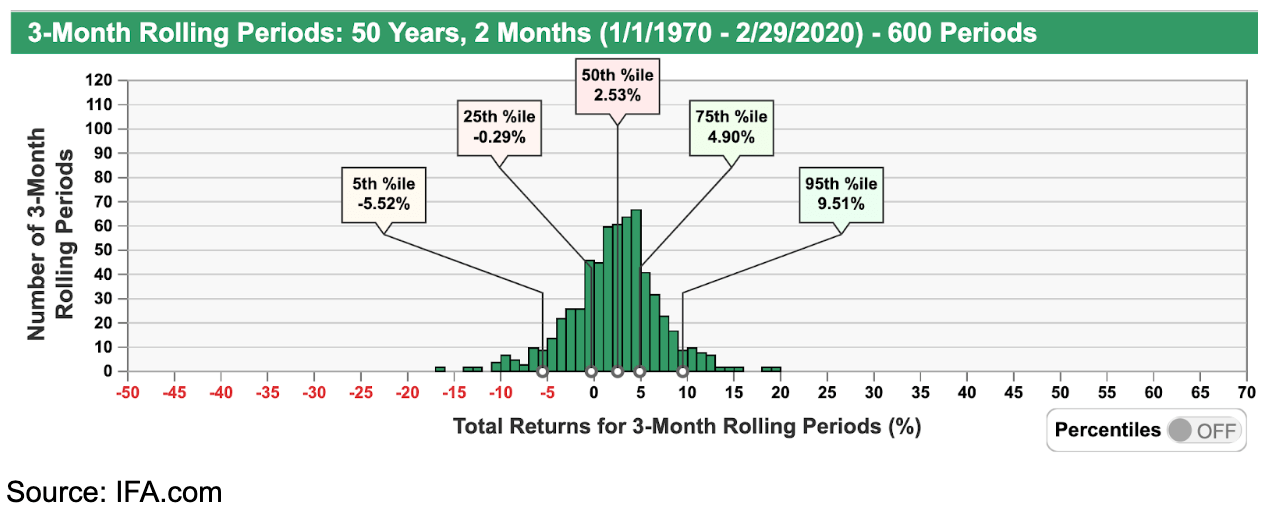
Here we have a chart that illustrates the value of having a diverse portfolio of stocks and bonds, in this case, a simple 50/50 mix. We’ll start with a chart that shows returns of a 50/50 portfolio when measured over short time periods. What we can see is that when we focus on really short term returns, they are pretty unpredictable. It also shows that even a well-balanced portfolio can decline by over 10% in a 3-month time period – as it’s happened 5 times in the past 50 years.
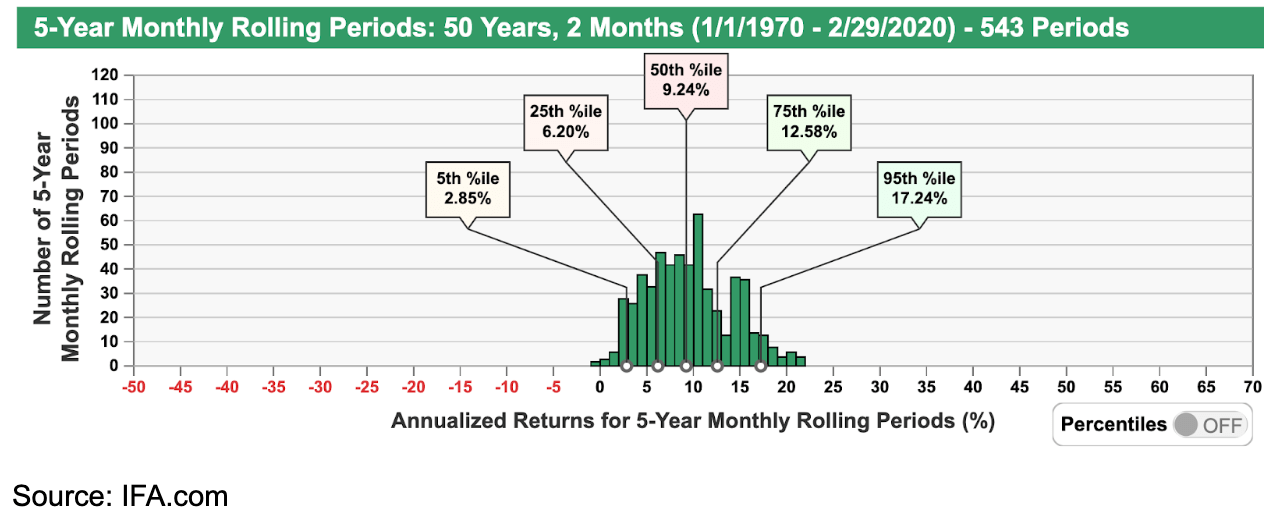
But when we zoom out, balanced portfolios are pretty resilient. Below is the same chart, but viewed with a 5-year time horizon. When viewed this way, only once in the past 50 years an investor would have lost money (and it was less than 1% loss). Over the past 50 years, the average annualized return of a 50/50 portfolio is 9.09%.
“But, this time it’s different.”
It’s amazing how fast 20 years go by, I’ve been in the investment management industry for 20 years this year. I started right at the beginning of the dot com bubble, heard a lot of people say how we’d never recover from those losses because that time, it was different. The same during the financial crisis. And about a dozen other times, the market fell 10%-20% for various reasons.
Every time, the market eventually recovered. Over these 20 years, the S&P 500 has dropped by 45% or more twice, yet has risen nearly 90% cumulatively over this time period.
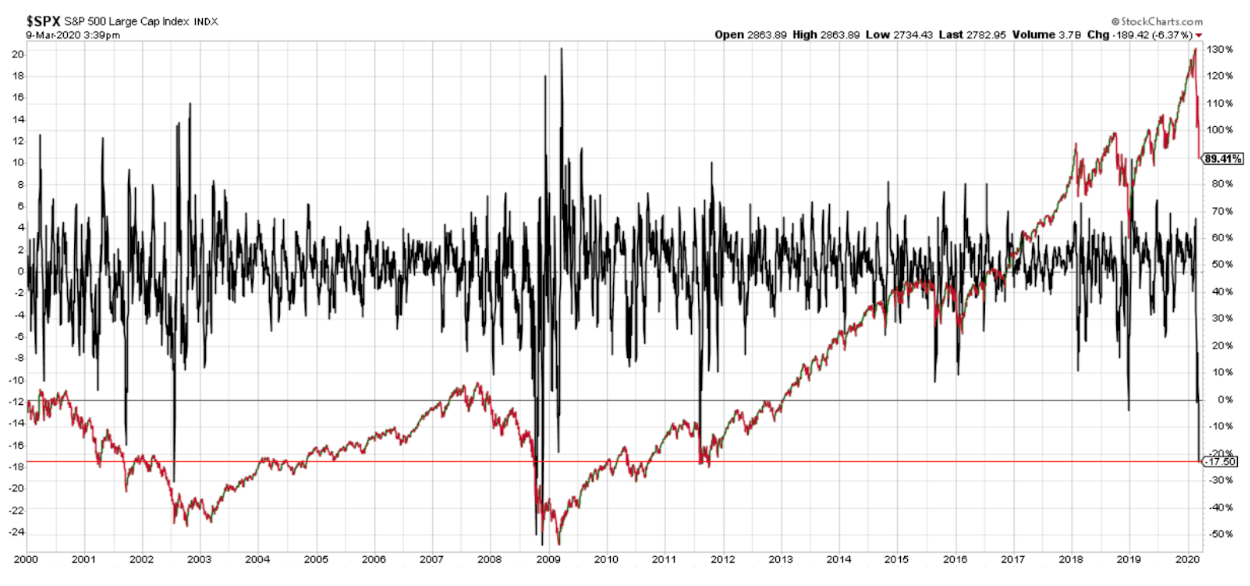
We’ll close with a chart that covers our investment team’s career in financial services. It’s a complicated chart, but shows on one axis the largest drawdowns and the other the total return of the S&P 500. We added a horizontal red bar that shows where we are today relative to the past 20 years. This has happened a total of 30 times (the chart scale makes it look like less, but that’s because of the scale – sometimes the drawdowns were clustered together). 28 out of the 30 times, the market was higher 12 months later. On average, it was up 19.81% higher.
This time could be different, or it could be the same. We wouldn’t suggest anyone use today as the signal to buy more stocks. But we would suggest people don’t use the recent news as a reason to sell them.
Get Physician Specific Financial Planning
Work with advisors that know physicians.
Get Financial Planning
Need help with something else?
Get Free Disability Insurance Quotes
Get Your Contract Reviewed